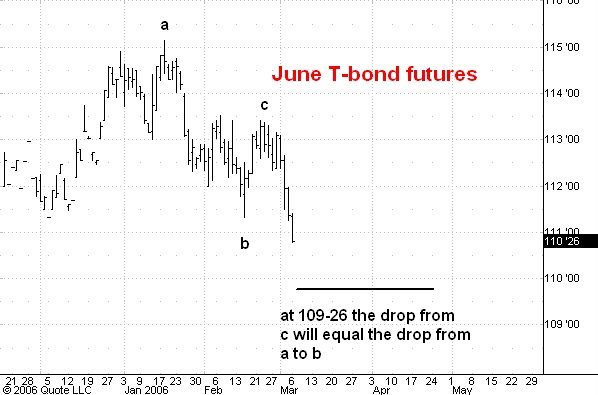
Here is a daily chart of the June T-bond futures.
The market rallied from a low in early November (at 110-12 basis December '05 futures) to a high in January at 115-13 in the March futures. I think we are in the middle of the second downswing from the 115-13 high. The first carried the March futures down 115 ticks from point a to point b. The market then rallied to point c at 113-13 in the March contract. Another drop of 115 ticks from point c in the June contract would carry the market to 109-26 or so. In fact I think the second swing down which started from point c will be longer than the first, so 109-26 is a minumum target.
As you know I expect this market to drop to 108 or lower over the next few months so only a modest rally will result once the swing down from point c is completed.
No comments:
Post a Comment