
Here is an updated 15 minute bar chart of the March S&P e-mini futures.
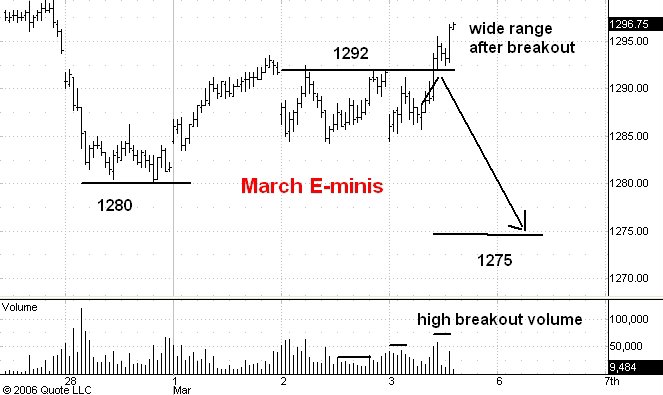
This morning I said that the market would probably rally to 1293. As you can see on the chart it has done that and more. In fact, move above the 1293 level now looks like a genuine upside breakout to me. Here's why.
The breakout volume was high as you can see on the chart. In fact it was even higher than it looks because it occurred during the lunch hour in New York, usually a slow time for all markets. After the breakout the market drifted back to 1293 but on low volume. Had the breakout been a fake one we would instead have seen the S&P dive back below 1293 and stay there. After the low volume test of the breakout level the market put in a wide range bar to new rally highs. Moreover, by this time the S&P's were more than 4 points into plus territory for the day.
The combination of these factors has convinced me now that the 1280 level was the reaction low and that we will soon be above 1300 and headed for 1320.
1 comment:
Based on the Bunker Curve that is used in the CapR model on www.businessallstars.com/calculator/capr the S & P is correctly priced around 1260. That is unless your estimation of growth for the overall market of 10.46% from Yahoo Financial, the average interest rate is 5.39 from Bloomberg, with an EPS for the index of 86 from Businessweek. The CapR model is surprisingly accurate.
Post a Comment