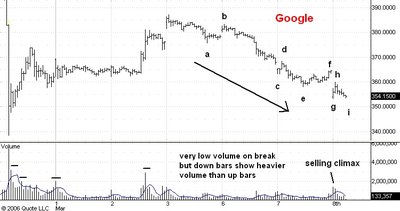
Here is an udpated 15 minute bar chart of Google which I last discussed here.
Late yesterday there was another piece of upsetting news for Google involving a mistaken posting on its web site that may have misled investors.
When I am bullish on a stock or a market and bad news comes out I look for signs of a selling climax, especially one that occurs at support and at a higher low. I think that this is what we are seeing in GOOG.
I estimate support today at 351. We clearly had a big volume spike on bad news at the open. that dropped the market to 353 and change. This is the biggest volume bar on the decline from 387 which has shown greatly reduced volume compared with the previous advance.
The rally from g to h was about as big as the rally from e to f but the drop from f to g took a lot less time than the one from d to e. If we see a slightly lower low at a possible point i near 351 and then rally above point h I will think that the low of the reaction from 387 is in place. Alternatively, any high volume break above point h would send the same message.
No comments:
Post a Comment