Wednesday, November 30, 2005

S&P Again


Here is another updated hourly chart of the December S&P futures.

The market has not bounced up from 1256 support. The refusal to rally from support is usually a sign that the market is headed lower. I think the reaction will now be as big (27 points or so) as the break at the end of October that ended near 118o. If so we should soon see the S&P futures near the 1/2 point of the current box at 1246. My best guess is that the market will stop a point or two above that level.
 

Advancing Issues


The chart you see above shows the daily count of the number of issues on the New York Stock Exchange which advance in price each day (in black) and the 10 day moving average of this number (red).


I last commented on the New York Stock Exchange advancing issues indicator here and here .

The interesting thing I see now is that while today the S&P futures made a new low for the reaction which started from the 1273 level, the number of advancing issues is much higher than it was on the first day of the break on Monday.

Given the very bullish condition of the market I'd say that this is a postive divergence and means that the S&P is about to start a rally to 1285 and higher.
 

S&P


Here is an updated hourly chart showing pit trading in the December S&P futures.

The market has dropped to the lower of the two support levels I have been watching and I think the next swing will carry upward to 1285 or so, near the 1/2 division point of the next box around 1290.
 

Eurocurrency


Here is an hourly chart showing pit and electronic trading in the December eurocurrency
futures.

I've been expecting a rally in the eurocurrency into the 122-123 range for several weeks now.
The market has been trying to rally since November 15, but without much success. Support levels eventually get stale and I think this is happening with the 117.00 level I have been watching.

You can see that the latest rally attempt was a very fast move up of 240 points but the new high was immediately rejected by the market and was followed by an equally steep sell-off. Now the market is trading below the top of its current box. My best guess now is that the eurocurrency is headed for 115.50 before it will try to rally again.
 

Bonds and Notes


Here are updated hourly charts showing pit trading in the March '06 T-bond and 10 year note futures.

I've transferred the boxes which I think are controlling the upmove from the November 4 low from the December into the March contracts.

As you can see both markets have dropped to the low of the current box. I think the next big swing in both will be upwards.

The move up from the November 4 low is a rally in a bear market in my view, but I think the bonds will get into the 115-116 range and the notes into the 111-112 range before the bear market resumes.
 

Guesstimates on November 30, 9:00 am ET

December S&P Futures: The S&P futures broke below 1260 support overnight but did hold the 1256 level. I think the next move will be upward to 1285.

March Bonds: Switching to the March contract. There is strong support at 112-04 and the next swing up should carry to 113-28. I expect this market to rally into the 115-116 zone before the bear market resumes.

March 10 Year Notes: Switching to the March contract. I expect support at 108-18 to hold and the next swing up to carry to 109-28. I expect this market to move into the 111-112 zone before the bear market resumes.

December Eurocurrency: I think 117.00 will hold and that the next step up will carry to 121.00. If 117.00 does not hold the downtrend will continue at least to 115.50 before another rally can start.

January Crude: The market is approaching support at 54.20.  I think a rally of five or six dollars will be the next big move.  

December Gold: Support stands at 490. The market is on its way to 507.

Google: I expect support near 400 to hold and the next swing up should carry to 442.  
 

Tuesday, November 29, 2005

Board of Trade


Here is a daily chart of the Chicago Board of Trade.

I thought that the market would hit 153 before 92 but today's low was 90.10. I've drawn a black line throught the downside breakout level at 94.75. I am willing to bet that the market will not spend much time trading below this level and that in a few days a rally in BOT will carry it above 94.75 to stay. I still think a move to 153 is likely before the bull market ends.
 

Google


Here is an updated daily chart of Google.

In this morning's guesstimate I said that 410 would be support but the market bounced only briefly off of that level. Still, I think there will be buyers at 401 because there the break from 431 will equal the length of the early October break.

I think the market will reach the 440 level before any extended reaction develops.
 

S&P


Here is an hourly chart of pit trading in the December S&P futures.

As you can see the market has come down a second time to the 1260 support level and I think it is in the process of making a low above yesterday's low at 1258.80. This means that the market will soon start a move up into the 1285-90 zone, just below the 1/2 division point of the next box at 1290.
 

Guesstimates on November 29, 9:15 am ET

December S&P Futures: The S&P futures dropped a point below the initial 1260-61 support level and this morning have rallied back to initial resistance around 1265.  I think there is still at least an even chance that the market will drop to 1256 before making new rally highs. Next step up will carry to 1282.

December Bonds: The bonds have started a new up leg which will probably carry to 113-25.  Support today is at 113-07. I expect this market to rally into the 115-116 zone before the bear market resumes.

December 10 Year Notes: The notes appear to have begun a move to 109-28. Support today is at 109-06. I expect this market to move into the 111-112 zone before the bear market resumes.

December Eurocurrency: I think 117.00 will hold and that the next step up will carry to 121.00.

January Crude: The market has held resistance at 58.90 and now will move to the downside target at 54.20.

December Gold: The market is on its way to 507.

Google: Short term resistance is at 433 while support is now 410.  
 

Monday, November 28, 2005

Nasdaq Composite Index


Here is a weekly chart of the Nasdaq Composite Index.

I have drawn the bull market boxes in red and two price targets for the bull market. The black line is drawn at 2567 which is 1/2 the all time high of 5133. I think this is the minimum target for the upmove from the 2002 low at 1108.

The blue line stands at 3120, the 1/2 division point of the range for the 2000 - 2002 bear market. I still think the market has at least a 50-50 chance of reaching this higher level before a break of as much as 30% occurs.
 

Eurocurrency


Here is a daily chart of the December eurocurrency futures.

I think the market is in the early stages of a move into the 122-123 range. Meantime the rally from last night's low near 116.85 should carry the market up to 121.00 or so before a reaction of a few days sets in.
 

S&P


Here is an hourly chart of pit trading in the S&P futures.

I think the reaction from 1273 will be about as big as the previous three reactions which were 10-12 points each. So the first support I see is 1260-61. If the market proves to be weaker than I think the worst I see on the downside is 1256.

After this break is over I expect to see a move up to the top of the next box at 1310 with temporary halts at 1282 and 1296.
 

Board of Trade


Here is a daily chart of the Chicago Board of Trade since its IPO.

There was another downgrade of BOT this morning but I think that there is very strong support at 94 and that BOT will trade over 150 in a few months.
 

Guesstimates on November 28, 8:40 am ET

December S&P Futures: The S&P futures have traded through  resistance in the 1265-68 zone.  Even so I think a reaction to 1260 is likely and the market may well drop a bit lower to 1256 before moving up again.  In any case I think the next step up will carry to 1282.

December Bonds: The bonds have started a new upleg which will probably carry to 113-25.  I expect this market to rally into the 115-116 zone before the bear market resumes.

December 10 Year Notes: The notes appear to have begun a move to 109-24. I expect this market to move into the 111-112 zone before the bear market resumes.

December Eurocurrency: I think 117.00 will hold and that the next step up will carry to 121.00.

January Crude: The market has held resistance at 58.90 and now will move to the downside target at 54.20.

December Gold: The market is on its way to 507.

Google: Short term resistance is at 433 while support is now 400.  
 

Friday, November 25, 2005

Guesstimates on November 25, 9:40 am ET

December S&P Futures: The S&P futures have traded through resistance in the 1265-68 zone. Even so I think a reaction to 1260 is likely and the market may well drop a bit lower to 1256 before moving up again. In any case I think the next step up will carry to 1282 or so.

December Bonds: The bonds have started a new upleg which will probably carry to 113-25. I expect this market to rally into the 115-116 zone before the bear market resumes.

December 10 Year Notes: The notes appear to have begun a move to 109-24. I expect this market to move into the 111-112 zone before the bear market resumes.

December Eurocurrency: I think support is now at 117.50. Next step up will carry to 121.00.

January Crude: The market is holding resistance at 58.90 and now will move to the downside target at 54.20.

December Gold: There is still a good chance we will see a reaction to 482 or so before a move to 507 develops.

Google: Broke past 418 resistance Wednesday and next stop will be 433.
 

Wednesday, November 23, 2005

S&P


Here is an hourly chart of the December S&P futures.

The advance from the October low at 1172 has been relentless. The market has now reached the top of its current box at 1268 and I think at least a modest reaction will be the next development. The previous three breaks have been between 10 and 12 points in length and my best guess now is that a reaction from 1268 will find support 12 points lower around 1256. A less likely development would be a drop to the 1/2 point of the current box at 1246.

In any case much higher prices still lay ahead. The next short term upside target for me is 1280 and I think the market will reach the 1350 level in a matter of a few months.
 

Eurodollars


Here is a daily chart of June '06 eurodollar futures.

The market has rallied to to just above the top of its current bear market box which is at 95.25. I think a reaction down to 95.18 or so would be normal but then I think the rally will resume and carry the market up close to the 1/2 point of the next higher box near 95.49.
 

Guesstimates on November 23, 8:40 am ET

December S&P Futures: The S&P futures have nearly reached resistance in the 1265-68 zone and now will probably react down to support around 1246. Next step up will be to 1280.  

December Bonds: The bonds will probably drop to support near 112-04 and then rally to 113-25.  

December 10 Year Notes: The notes will probably drop to support near 108-20 and then rally to 109-28.

December Eurocurrency: The market hit 118.90 early this morning and then dropped. I think support has come up to 117.50. Next step up will carry to 121.00.

January Crude: The market has held resistance at 58.90 and now will move to the downside target at 54.20.

December Gold: There is still a good chance we will see a reaction to 482 or so before a move to 507 develops.

Google: Resistance is at 418 while support is now at 396.
 

Tuesday, November 22, 2005

S&P


Here is an hourly chart showing pit trading in the December S&P futures.

The top of the current box is at 1268 and I think the market is going to have a hard time moving past the 1265-1268 zone without first reacting back to support near 1246.
 

Still Lots of Bears


My casual impression gleaned from reading blogs and other stock market commentary is that technical types are seeing many "divergences" in the US stock market. For this reason they have been selling all the way up from the S&P low at 1168 on October 13.

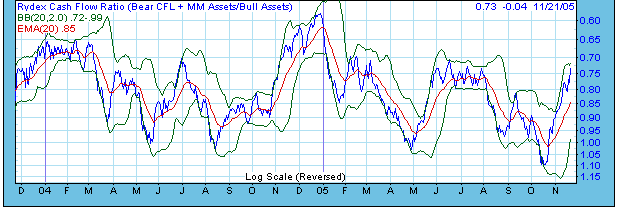
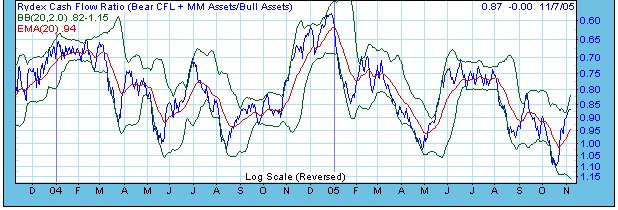
Here is a chart of the Rydex Cash Flow Ratio maintained by Decisionpoint.com. The blue line is the daily value of the ratio and the red line is its 20 day exponential moving average.

I last commented on the Rydex Ratio here. Recall that high values of the ratio (which show up as low levels on the chart because of its inverted scale) mean that market timers are moving relatively large amounts of money out of stock market bull funds into bear funds and cash. From a contrary opinion point of view such a situation offers a bullish prognosis for stock prices.

At the October low this Rydex ratio reached the highest level in the past 5 years (i.e. showing the lowest level in 5 years on the chart). This is an extreme level of bearishness and is one of the factors that gave me confidence that a big rally was imminent then.

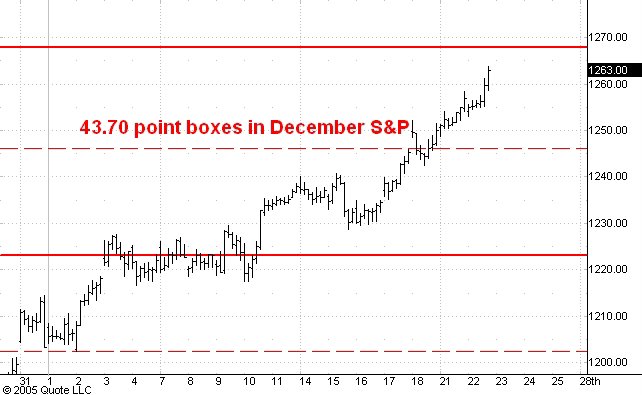
Right now the red line (20 day exponential moving average) is at 0.84, still quite a ways from its July '05 level of 0.76 and even further from its January '05 level of 0.62. Yet the S&P 500 is at new bull market highs for the move up from its 2002 low at 768. I think this divergence is telling us that there are still too many bears out there for the upmove to end and that substantially higher prices will be seen during the next few months.
 

Eurocurrency


Here is an hourly chart of pit and electronic trading in the December eurocurrency futures.

I think the market has held support at 117.00 and is now headed for 119.00 and eventually to 122.00.
 

Crude Oil


Here is an hourly chart showing pit and electronic trading in January '06 crude oil futures.

I think the rally from last week's low at 56.30 is over and that the market will now head down to 54.20.
 

Guesstimates on November 22, 8:40 am ET

December S&P Futures: The S&P futures are headed for the top of the box near 1265. support is 1238.

December Bonds: The bonds will probably drop to support near 112-04 and then rally to 113-25.  

December 10 Year Notes: The notes will probably drop to support near 108-10 and then rally to 109-28.

December Eurocurrency: I think the 117.00 level will hold and that the market will now rally to 118.90 and then to 122.00.

January Crude: The market is headed for 54.20 and meantime 58.90 is resistance.

December Gold: The market hit 495 overnight but there is still a good chance we will see a reaction to 482 or so before a move to 507 develops.

Google: Resistance is at 418 while support is at  379.
 

Monday, November 21, 2005

Crude Oil


Here is an hourly chart showing pit and electronic trading in January '06 crude oil.

I think this market is headed for 54.20 but first it looks to me like we'll see this small rally continue up to 58.80.
 

Chicago Board of Trade


Here is a daily chart of Chicago Board of Trade since its IPO.

The market is resting just below the 2/3 division point of its range and visibly above the 1/2 division point (not shown) around 106. I think BOT is about to move up to the 1/3 point of the next box near 153.
 

Chicago Merchantile Exchange


Here is a daily chart of Chicago Merchantile Exchange class A stock.

The market has nearly reached my bull market target of 420 or so but CME is still a market leader and shows no sign of ending its long advance. I think the current reaction is over and that the market is now headed for the top of the next box near 428.
 

Sears Holdings


Here is a daily chart of Sears Holdings.

I have been expecting a brief drop to the 108 level and then a move upward into the 140-150 zone. I now think we have seen the low in SHLD and that the market is headed upward. The 1/2 point of the next higher box near 137 is the first likely target.
 

Gold


Here is an hourly chart of pit and electronic trading in December gold futures.

The market has reached the 490 level and has visibly been trading essentially sideways for a few days. I think we will see a reaction to 480 or so followed by another upthrust which will carry close to the top of the next box near 510.
 

Guesstimates on November 21, 8:50 am ET

December S&P Futures: The S&P futures are headed for the top of the box near 1265. support is 1238.

December Bonds: The bonds will probably drop to support near 112-04 and then rally to 113-25.  

December 10 Year Notes: The notes will probably drop to support near 108-10 and then rally to 109-28.

December Eurocurrency: I think the 117.00 level will hold and that the market will now rally to 118.90 and then to 122.00.

January Crude: The market is headed for 54.20 and meantime 59.80 is resistance.

December Gold: There should be a modest reaction from 490 back to 480 or so and the next step up should be to 507.

Google: Resistance is at 418 while support is at  379.
 

Friday, November 18, 2005

S&P Bull Market Boxes


Here is a daily chart of the cash S&P 500 index going back to the August '04 low near 1060.

I have drawn the boxes which I believe are controlling the bull market advance from the October 2002 low at 768. These boxes are 187 points high.

As you can see the index has established a new high print for the bull market this morning and I believe this represents the early stage of a decisive move above the 1/2 point of the box which stands around 1236. The top of the current box is roughly 1328 and my preferred bull market target of 1355 is just a tad above there.
 

Guesstimates on November 18, 8:50 am ET

December S&P Futures: The S&P futures have reached resistance at 1246.  Support is still at 1228 but if this is a strong breakout move I would expect any reaction to make a higher low around1238.  Next upside target is the top of the current box near 1265.

December Bonds: The bonds are headed for 115-08 at least.  Short term resistance is at 113-25 and support is now at 112-04.  

December 10 Year Notes: The notes nearly reached 109-08 and support is still at 108-10. Next upside target is 109-28 and the market should reach 111-00 over the next few weeks.

December Eurocurrency: I think the 117.00 level will hold and that the market will now rally to 118.90 and then to 122.00.

January Crude: The market is headed for 54.20 and meantime 59.80 is resistance.

December Gold: There should be a modes reaction from 490 back to 480 or so and the next step up should be to 507.

Google: Resistance is at 418 while support is at  379.
 

Thursday, November 17, 2005

T-bonds


Here is an hourly chart showing pit trading in the December t-bond futures.

I've drawn the 48 tick boxes for the uptrend which began from 110-12 on November 4. My best guess right now is that the market will rally close to the 1/2 point of the next box up from here near 114-04 and then react. I think it will stop shy of that level by a few ticks.

Looking further ahead I think this market will get up to at least 115-08. I suspect it will go up even more than that because of the extensive bearish sentiment among the public. But I don't want to get too enthusiasic about its upside potential just yet because my monthly chart developed a long term bearish signal at the end of October which portends a move down at least to 107 in 2006.
 

S&P


Here is an hourly chart of pit trading in the December S&P futures.

You can see the sequence of higher lows that has developed since the October 13 low at 1172. This is a very bullish sign. Lots of market technicians are selling this market because they see various kinds of divergences as the S&P approaches its bull market high of 1250. This has been a smart tactic for most of 2004 and 2005 but I think the market is about to change the lock on its vault of trading profits.

I think we will see 1246 within a day or two and the 1265 level within a couple of weeks. Looking into 2006 I think the 1350 level is a reasonable expectation.
 

Guesstimates on November 17, 8:50 am ET

December S&P Futures: The S&P futures are headed for the next upside target near 1246. Support is at 1228.

December Bonds: The bonds made an important low at 110-12 and are headed for 115-08 at least.  Short term resistance is at 113-25 and support is now at 112-04.  

December 10 Year Notes: The notes are headed for  109-08 and should reach 111-00 over the next few weeks. Support today is 108-10.

December Eurocurrency: I think the 117.00 level will hold and that the market will now rally to 118.90 and then to 122.00.

January Crude: The market is headed for 54.20 and meantime 59.80 is resistance.

December Gold: Support is at 465 and the next step up will be to 500 with a brief intervening reaction from 490..  

Google: Resistance is at 418 while support is at  379.
 

Wednesday, November 16, 2005

S&P


Here is an hourly chart of the December s&P futures.

Yesterday I said that the 1228 level looked like support and so far it has held. The next step up from here should be to 1246.
 

Projecting an S&P Top


Here is a weekly chart of the cash S&P 500 index.

Over the past two years there have been two extended upmoves. The first began from the 1060 level in August of 2004 and ended near 1228 in March 2005. It carried the average up about 16%. The second began in April 2005 near 1136 and ended in July near 1245, a rally of about 10%.

I think a comparable upmove began this past October from 1168. A 10% rally from that level would carry the index to 1285 while a 16% rally would end near 1355. I think 1355 is a more likely target given the extreme level of bearish sentiment seen in October.

My current interpretation of Lindsay's Three Peaks and a Dome House suggests a top in early May 2006.
 

IBM


Since its low this past September around 77 IBM has become a market leader. It has just broken above the highs of its last box and is now headed for 92-94. This bodes well for the market averages and is consistent with my view that a big rally lies ahead.
 

Baidu


Here is a daily chart of Baidu.com.

I think the market has found support at 68, a level higher than its recent low at 60. The market is preparing to move up to the 1/2 point of its historical range near 105 and after that to the 2/3 level near 120.
 

Google


Here is a daily chart of Google. Next stop: 418.
 

Crude Oil


Here is an hourly chart showing pit and electronic trading in January '06 crude oil.

I think this market is headed for 54.20 but first it looks ready to rally to resistance around 59.80.

Once the 54.20 level is reached I think a move above 60.00 will follow.
 

Gold


Here is an hourly chart of December gold futures showing pit and electronic trading.

I think gold is headed first to 490 and then, after a brief reaction, over the 500 level. I think we will see a bull market top somewhere in the 500 to 550 range and then a drop back below 400.
 

Guesstimates on November 16, 8:50 am ET

December S&P Futures: The S&P futures are headed for the next upside target near 1246. Support is at 1228.

December Bonds: The bonds made an important low at 110-12 and are headed for 115-08 at least.  Short term resistance is at 113-25 and support is at 111-16.

December 10 Year Notes: The notes are headed for  109-08 and should reach 111-00 over the next few weeks.

December Eurocurrency: I think the 117.00 level will hold and that the market will now rally to 118.90.

January Crude: The market is headed for 54.20 and meantime 59.80 is resistance.

December Gold: Support is at 465 and the next step up will be to 500.  

Google: Resistance is at 418 while support is at  379.
 

Tuesday, November 15, 2005

S&P


Here is an updated hourly chart of pit trading in the December S&P futures.

The market is reacting from this morning's high but I think it will find support near 1228 (black line). At that level the reaction will match the length of the last reaction (12 points) and will have dropped to the level of the November 3 top which started a week long trading range.
 

Crude Oil


Here is a daily chart of January '06 crude oil futures. I have drawn the bear market boxes which are $8.35 wide and were defined by the first big break in the October '05 futures.

You can see that the bottom of the second box is around the 54.20 level and that is where I think January futures are headed. The market is now trading around the 1/2 point of that box but I think any rally from here will stop around 59.80.
 

Eurocurrency


Here is a daily chart of the December eurocurrency futures.

The market has dropped a bit lower than I had anticipated but I still think it will rally to the top of the next higher blue box and to the 1/2 division point of the bear market box you see on the chart. This would be a move upward of about 500 points to 122.00 or so.
 

Bonds


Here is an updated hourly chart of pit trading in the December t-bond futures.

The thing that leaps out of this chart for me is the second higher low made this morning after the PPI and retail sales numbers. Given the tremendous amount of bearish sentiment about bond prices that Mark Hulbert pointed out here I think this is a very bullish development.

I now think that the November 4 low at 110-12 marked the end of the drop from the June 3 top at 119-23 (basis September futures). The market is likely to move up to at least 115 before the drop to 107 resumes.
 

Guesstimates on November 15, 8:50 am ET

December S&P Futures: The S&P futures are headed for the next upside target near 1246. Support is at 1227.

December Bonds: Resistance is 112-02 and I think the bonds are headed down to 110-00. After that a rally of several points is likely.

December 10 Year Notes: Resistance is 108-12 and the notes are headed down to 107-00. From there a rally of several points is likely.

December Eurocurrency: I think the 117.00 level will hold and that the market will now rally to 118.90.

January Crude: The market should be trading at or below 56.00 soon and meantime 59.80 is resistance.

December Gold: Support is at 465 and the next step up will be to 500.  

Google: Resistance is at 418 while support is at  379.
 

Monday, November 14, 2005

Guesstimates on November 14, 9:00 am ET

December S&P Futures: The S&P futures are headed for the next upside target near 1246.

December Bonds: Resistance is 112-02 and I think the bonds are headed down to 110-00. After that a rally of several points is likely.

December 10 Year Notes: Resistance is 108-12 and the notes are headed down to 107-00. From there a rally of several points is likely.

December Eurocurrency: I think the 117.00 level will hold and that the market will now rally to 118.90.

January Crude: A rally to 59.80 or so is now likely but the market should be trading at or below 56.00 soon.

December Gold: Support is at 465 and the next step up will be to 500.  

Google: Resistance is at 418 while support is at  379.
 

Friday, November 11, 2005

Microsoft


Here is a weekly chart of Microsoft since its all time high of 54.81 in late 1999. (Note that the prices shown on the chart have been adjusted for dividend payments.)

I have drawn the divisions of the all time high in blue and red.

MSFT has traded sideways for 5 years now since its low at 18.39 in December 2000. I think this is preparation for a very big upmove which will carry to new all time highs. In the meantime I am expecting a breakout above the 28 level which will carry MSFT to the 2/3 division point near 36 and then to the 3/4 point at 41.
 

Board of Trade


Here is an hourly chart of Chicago Board of Trade A since its IPO last month.

I am estimating a box size of 54.51 points and have shown the 1/3 and 2/3 division points. I think that BOT will reach the top of the next box near 189 before the bull market ends. In the mean time I think that the next upside target will be the 1/3 point of the next box around 152.
 

Sears Holdings


A few months ago I thought Sears Holdings would move above the 200 level. But since then corporate developments knocked this stock out of its bull market leadership position.

I think that SHLD is forming an important low near the 2/3 division point of its all time range of 14.72 to 163.50. I expect one more brief dip below the low of the recent trading range. The market will probably get down to 108 or so ( 2/3 of the all time high is 109) to shake out the remaining weak longs. Then I think we will see a rally to a lower top near 150 or so before another long downleg starts.
 

IBM


Here is a daily chart of IBM. I have adjusted the position of the price boxes slightly.

My longer term target for IBM is 108. Over the next few months I think we will see a two box move upward to 96 or so.
 

Guesstimates on November 11, 8:45 am ET

December S&P Futures: The S&P futures are headed for the next upside target near 1246.

December Bonds: The bonds are headed down to 110-00.  

December 10 Year Notes: The notes are headed down to 107-00.

December Eurocurrency: I think the 117.00 level will hold and that the market will now rally to 118.90.

December Crude: A rally to 59.00 or so is now likely but the market should be trading below 56.00 soon.

December Gold: Support is at 460 and the next step up will be to 500.  

Google: Resistance is at 418 while support is at  379.
 

Thursday, November 10, 2005

S&P


Here is an hourly chart of pit trading in the December S&P futures.

I thought the market had started a breakout move Wednesday morning but this morning the bears decided to make one more stand. The subsequent reaction ended just a tad below the low of the last reactions and then the market moved decisively above the top of its box at 1224. I think 1246 will be reached today or tomorrow and that much higher prices will be seen by the end of the year.
 

Guesstimates on November 10, 9:10 am ET

December S&P Futures: The S&P futures are headed for the next upside target near 1246.

December Bonds: The bonds are headed down to 110-00.  

December 10 Year Notes: The notes are headed down to 107-00.

December Eurocurrency: The market has reached the 17.50 to 118.50 target area and I think the next big move will be upward.

December Crude: The market is headed for the next downside target at 57.90. The market should be trading below 56.00 soon.

December Gold: The next step up will be to 500.  

Google: Resistance is at 418 while support is at  379.
 

Wednesday, November 09, 2005

S&P


Here is an hourly chart of pit trading in the December S&P futures.

A couple of hours ago the market accelerated above the top of the box at 1224. It has since reacted slowly back to the breakout level. Coming after a series of higher lows I think this action is telling us that much higher prices are imminent.
 

Crude Oil


Here is an hourly chart of pit trading in December crude oil.

I think the market is headed for the 55.50 level which is the 3/4 division point of the historical range of futures trading (9.75 to 70.90). Before this market can rally substantially I think we will have to see a short term wash out which brings prices down sharply over the course of 2-3 days.
 

Gold


Here is an updated hourly chart showing pit and electronic trading in December gold.

This market is headed for 500.
 

Bonds and Notes


Here are updated hourly charts showing pit trading in the December t-bond and 10 year note futures. I have drawn my estimates of the boxes which are controlling the drop from the post Katrina high at 118-10 in the bonds and 112-20 in the notes. These boxes have not been working as well as they normally do during this drop so I am relying on them less when estimating support and resistance.

In any case I think the bonds are now headed for 110-00 and possibly to the low of the box near 109-16 or so. The notes I think are on the way to 107-00. There is heavy bearish sentiment in the bonds and notes as Mark Hulbert has noticed in this recent column. So I think this leg down to 110-00 and 107-00 is very likely to be the last one in the drop from the late August top. I would then expect a rally of about 4 1/2 points in the bonds and 2 1/2 points in the notes.
 

Guesstimates on November 9, 8:50 am ET

December S&P Futures: The S&P futures are headed for the next upside target near 1246.

December Bonds: The bonds appear to be stalling at 111-24 and I think the next move will be downward to 110-00.  

December 10 Year Notes: The notes traded a few ticks above 108-06 but I think yesterday’s high at 108-14 will hold and that the market will head down to 107-08.

December Eurocurrency: The market has reached the 17.50 to 118.50 target area and I think the next big move will be upward.

December Crude: Resistance is at 61.50. The market is headed for the next downside target at 57.90. The market should be trading below 56.00 soon.

December Gold: I don’t think the market will hit 455 and if I am right the next step up will be to 500.  If 455 is hit then continuation downward to 446 or so will become likely.  

Google: Resistance is at 406 while support is at  379.
 

Tuesday, November 08, 2005

Rydex Cash Flow Ratio


The chart above shows the Rydex cash flow ratio (blue line) and its 20 day exponential moving average (red line). High levels of this ratio (which show up as low levels on the chart) indicate that the trading public is bearish and this is a bullish omen for stocks. I last commented on the Rydex ratio here. You can access this ratio by subscribing to Decisionpoint.com. I think this is well worth the $20 per month subscription price.

At the October lows this Rydex ratio was at 5 year highs, thus showing a remarkable level of bearish sentiment given the modest extent of the drop from the bull market top. Before this upmove ends I expect to see the ration below 0.70 (its level at the July '05 high) and probably near or below 0.60 (its level at the January '05 high). Right now the ratio is 0.87 and this indicates that the current rally has quite a way to go yet.
 

S&P


Here is an updated hourly chart of the December S&P futures.

As you can see the market has been trading sideways for a couple of days just below the top of the current box at 1224. After the run up from the October 28 low near 1180 a reaction to the blue line near 1213 would have been normal. Instead we see a market that today made a higher low (black lines) after a subnormal reaction that ended around 1217.

I think this is a sign of strength and it is telling me that the market will probably hit 1246 before a more substantial reaction develops. Even if I am wrong about this I still believe that the blue line will support any reaction from current levels.
 

Eurocurrency


Here is an updated hourly chart of pit and electronic trading in the December eurocurrency futures.

I think this market made an important low this morning at 117.32; even if I am wrong I don't think it will drop as low as 117.10. The intial rally from the low is likely to stop near the top of the next box up around 119.90.
 

Guesstimates on November 8, 9:10 am ET

December S&P Futures: The S&P futures are headed for the next upside target near 1246 but a drop into the 1212-1213 zone is likely first.

December Bonds: The bonds will extend their rally to 111-24 before turning lower.

December 10 Year Notes: The notes will stay below 108-06 and then take another step down to 107-00.

December Eurocurrency: The market has reached the 17.50 to 118.50 target area and I think the next big move will be upward.

December Crude: Resistance is at 61.50. The market is headed for the next downside target at 57.90. The market should be trading below 56.00 soon.

December Gold: I don’t think the market will hit 455 and if I am right the next step up will be to 500.  If 455 is hit then continuation downward to 446 or so will become likely.  

Google: Resistance is at 406 while support is at  379.
 

Monday, November 07, 2005

Crude Oil


Here is an hourly chart of pit trading in December crude oil.

I think the market is headed for the 1/2 point of the next lower box at 57.90. I think the next big rally of several dollars will probably start once the 55.60 level is reached. This is the 3/4 divsion point of the all time range in futures from 9.75 to 70.90.

I also think that a bear market started from the 70.90 level. It will probably carry crude down to at least the 1/2 divison point of the all time range near 40.00. In fact I think a drop to 1/2 the all time high at 35.45 is even more likely.
 

Google


Here is an updated daily chart of Google.

When I first talked about Google on this blog it was trading at about 220 and I mentioned that I initially had a 500 target for GOOG. It seemed crazy then but not so crazy now.

My current view is that GOOG will make it into the 425-475 range. As long as GOOG outperforms the market averages I see no reason to abandon long positions held as longer term investments.

Over the shorter term I think that GOOG will start trading sideways for awhile once it rallies into the 410-425 zone. The top of the current box is near 417.
 

Guesstimates on November 7, 8:50 am ET

December S&P Futures: It now looks like the S&P futures are headed for the next upside target near 1246. The 1212-1213 zone is still support.

December Bonds: The bonds are not likely to rally past 111-10 before dropping to 110-00.

December 10 Year Notes: The notes will stay below 108-06 and then take another step down to 107-00.

December Eurocurrency: The market has reached the 17.50 to 118.50 target area and I think the next big move will be upward.

December Crude: Resistance is at 61.50. The market is headed for the next downside target at 57.90. The market should be trading below 56.00 soon.

December Gold: I don’t think the market will hit 455 and if I am right the next step up will be to 500.  If 455 is hit then continuation downward to 446 or so will become likely.  

Google: Resistance is at 389 while support is at  361.
 

Friday, November 04, 2005

S&P


I still think the December S&P futures will get down to support in the 1212-1213 area. But I am very bullish and so far the length of the current reaction from 1227.70 is only a point shy of the length of the last reaction. So if the market starts to accelerate upward from here I will have to chase it because it will probably then be heading for 1246.
 

Eurocurrency


Here is a daily chart of the December eurocurrency futures.

The market has finally dropped into the 117.50 to 118.50 target range. So far no cascade of selling has developed in response to an obvious break of several low points and I interpret this as a bullish omen. Even so, I think the market will make it down at least to 118.00 before it starts to set the stage for a big rally.
 

Gold


Here is and hourly chart of pit and electronic trading in December gold futures.

The market has broken below 461 support but so far has stopped at the bottom of its box. I am willing to go out on a limb here and say that the market won't hit 455. If it does then I'll have to expect continuation down into the 442-445 near the bottom of the next box.
 

Guesstimates on November 4, 8:45 am ET

December S&P Futures: The market will probably bounce off of 1223 resistance but I thin that support in the 1212-1213 zone will hold. Next step up will carry to 1246.  

December Bonds: The bonds reached minor support at 110-18 this morning but they are not likely to rally past 111-10 before dropping to 110-00.

December 10 Year Notes: The notes bounced off of support at 107-20 this morning but I think they will stay below 108-06 and then take another step down to 107-00.

December Eurocurrency: The market is on its way to my 117.50 to 118.50 target area.

December Crude: Resistance is at 61.50. The market is headed for the next downside target at 57.90. The market should be trading below 56.00 soon.

December Gold: The market is now headed for 500. Support is at 461.

Google: Resistance is at 389 while support is at  361.
 

Thursday, November 03, 2005

Sears Holdings


Here is a daily chart of Sears Holdings.

SHLD is no longer one of the bull market leaders. But I do think the drop from 163 is nearly over. Look for a low in the 105-110 range soon followed by a rally back at least to 140.
 

Chicago Merchantile Exchange A


You can find my previous posts on CME here , here , here and here . Above you will see an updated daily chart.

CME is getting closer to my bull market target of 410. Since I don't think the bull market is nearly over and since CME is one of the market's leaders I have to think that 410 is going to prove too conservative a target. I'll go a little bit further out on my favorite limb and guess that CME will hit 445 before the fireworks end.
 

Nasdaq Composite


Here is a weekly chart of the Nasdaq Composite index.

I've commented on this chart previous posts here , here and here.

My views have not changed. I think a move up to 2566 which is 1/2 the all time high of 5133 is a virtual certainty while an even bigger move to 3130, the halfway point of 2000-2002 bear market is an even bet. This bull market has much further to go.
 

S&P


Here is an updated hourly chart of the December S&P futures.

The market has reached the top of the current box near 1224 and moved a few points above 1223 which I had cited as minor resistance. I think the market is in the early stages of a breakout move and if I am right about this the reactions against the trend will get progressively smaller. So I think that any reaction from here will find support around 1212-1213 and that the next step up will carry to the 1/2 point of the next box around 1246.
 

Guesstimates on November 3, 8:50 am ET

December S&P Futures: The market will probably bounce off of 1223 resistance but should be able to hold just above the  ½ point of the box at 1202. Next step up will carry to 1246.  

December Bonds: The longer term trend in the bonds is downward. Resistance above the market is still at 112-16 and the next step down will carry to 110-18.

December 10 Year Notes: The longer term trend is downward.  Resistance above the market is at 108-24 and the notes are taking another step down to 107-20.  

December Eurocurrency: The market stalled at 121.80 resistance and is now on its way to my 117.50 to 118.50 target area.

December Crude: The market is headed for the next downside target at 57.90. Resistance is at 61.50. The market should be trading below 56.00 soon.

December Gold: The market is now headed for 500. Support is at 461.

Google: Resistance is at 389 while support is at  361.
 

Wednesday, November 02, 2005

Update for Lindsay's Basic Advances and Declines in the Dow


In this October 7 post I discussed my interpretation of the Lindsay's basic advances and declines in the Dow industrials over the past 7 years. I just took another look at the associated chart and realized that the most important part of the post, the forecast part, talked about basic advances and declines that were not shown on that chart.

So here is an enhanced version of the same chart. The extended basic advance from April 2, 2001 to January 8 2002 is shown in blue, the subsequent basic decline in red and the projected subnormal basic advance in purple.

I might add that the basic advance which is shown ending in March 2005 was an extended basic advance and for that reason is likely to develop what Lindsay called a "right shoulder". This is another upleg in the bull market that often exceeds the top of the basic advance and ends six to twelve months later. Such a right shoulder top would be consistent with my current interpretation of Lindsay's three peaks and a domed house formation as well as with the 15 year three month time period from low to high and the projected subnormal basic advance from the October 2004 low.
 

Eurocurrency


Here is a daily chart of the December eurocurrency futures.

You can see that the market has traded sideways this past month in a tight range right at the low it made in July. Then the eurocurrency rallied quickly away from its low but now several rally attempts stalled at 121.80 resistance. This is telling me that the market has to go lower to attract more determined buyers. I still think the the next big rally will start from the 117.50 to 118.50 zone.
 

S&P


Here is an updated hourly chart of the December S&P futures.

The lower top at 1210.50 after the Fed interest rate increase yesterday afternoon led me to conclude that the market would make a lower low at 1195. This morning you can see that the market is instead breaking out above that 1210.50 top. Since I am very bullish I must conclude that we are on the way to 1223 and eventually much higher than that.
 

Guesstimates on November 2, 8:50 am ET

December S&P Futures: The market will probably drop to 1195 and then begin its next step up to 1223.  

December Bonds: The longer term trend in the bonds is downward. Resistance above the market is still at 112-16 but another step down to 110-18 is likely first.

December 10 Year Notes: The longer term trend is downward.  Resistance above the market is at 108-24 and the notes are taking another step down to 107-20.  

December Eurocurrency: The market stalled at 121.80 resistance and is now on its way to my 117.50 to 118.50 target area.

December Crude: The market is headed for the next downside target at 57.90. The market should be trading below 56.00 soon.

December Gold: The market is now headed for 500. Support is at 461.

Google: Resistance is at 389 while support is at  361.
 

Tuesday, November 01, 2005

S&P


Here is an hourly chart of pit trading in the December S&P.

The market rallied initially after the Fed announcement of a 25 basis point increase in the funds rate. Since then it has sold off and shows what appears to be a lower top relative to yesterday's high at 1214.50. Since lower tops are typically followed by lower lows I am looking for this reaction to continue down to support near 1195. This would make the reaction just a bit less than 1/2 a box in length.

Once the reaction is complete I expect the next leg up to carry to the top of the box around 1223.
 

Gold


As you can see December gold has reached support at 461 and I now think the market will head up to 500 from here.
 

The Main Stream Media Just Doing Their Job


In my last post I pointed out that the University of Michigan's index of consumer sentiment showed an extraordinarily depressed group of consumers in the USA.One reason for this is the relentless emphasis by the main stream media on negative stories and negative interpretations of any news event. Of course the MSM aren't entirely to blame. After all they are in the business of telling people what they want to hear. That is why they are so useful as a gauge of popular sentiment.

Here are two recent magazine covers, one from the The Economist and the second from Time Magazine. The Economist cover depicts President Bush being blown away in a hurricane of his mistakes. The Time cover screams about " The Great Retirement Ripoff ". It explains how nasty corporations and their partners in crime, the US congress, are picking people's pockets and denying them their promised retirement benefits.

I think it is worth remembering the last Time cover story that screamed about disappearing retirement savings. Here it is. Note the date: July 29, 2002. Just a few days earlier the S&P 500 had hit 771. Today it is above 1200. Draw your own conclusions.
 

Consumer Sentiment


Over the past few months I have often pointed out that the attitudes of the "man-in-the-street" in the US towards the economy, the stock market and towards the country's political leadership were extraordinarily negative for this point in the stock market and economic cycle.

In this regard Bryce Logan has brought my attention to the University of Michigan index of consumer sentiment (thanks Bryce!). The chart above this post comes courtesy of Black Flag Partners and shows this consumer sentiment index for the past 25 years.

You can see that the most recent reading in the index is the lowest in more that 12 years ! The most remarkable thing here is that previous low readings like this typically were associated with a depressed stock market and great economic turmoil.

For example, the sentiment index reached an extreme low in early 1980 when inflation seemed completely out of control and gold reached $850 and silver $40 per ounce. The bond market was crashing and in March 1980 the Dow dropped as low as 729. The Dow has not been that low any time over the subsequent 25 years. And during the 8 months after March 1980 the Dow rose 25% !

We had a similar situation in the fall of 1990. War threatened in Iraq, oil had risen to a record $40 per barrel and the whole savings and loan industry had collapsed amidst fears of a general banking panic. The Dow reached a low of 2360 in October 1990 and then more than tripled over the next 10 years.

Most of you will recall the gloomy situation in the fall of 2002. The S&P had fallen 50% from its 2000 top and the Nasdaq 90%. Corporate accounting scandals were the order of the day and the greatest economic fear was out-of-control deflation as occurred in Japan during the 1990's. In retrospect this was also a great time to buy stocks as the S&P rose more that 60% over the next 30 months.

The folks at Citigroup.FX technicals think that history will repeat itself now. They think a big stock market rally lies dead ahead because consumer sentiment is so depressed. I agree.
 

Guesstimates on November 1, 8:50 am ET

December S&P Futures: The market is headed for 1223 and eventually to 1350. Support is at 1195.

December Bonds: The longer term trend in the bonds is downward. Resistance above the market is at 112-16.

December 10 Year Notes: The longer term trend is downward.  Resistance above the market is at 108-24.

December Eurocurrency: The market stalled at 121.80 resistance and is now on its way to my 117.50 to 118.50 target area.

December Crude: The market is headed for the next downside target at 57.90. The market should be trading below 56.00 soon.

December Gold: The market is now headed for 500. Support is at 461.

Google: Has reached the short term upside target at 369. Support is now at 352 while next step up will carry to 389.