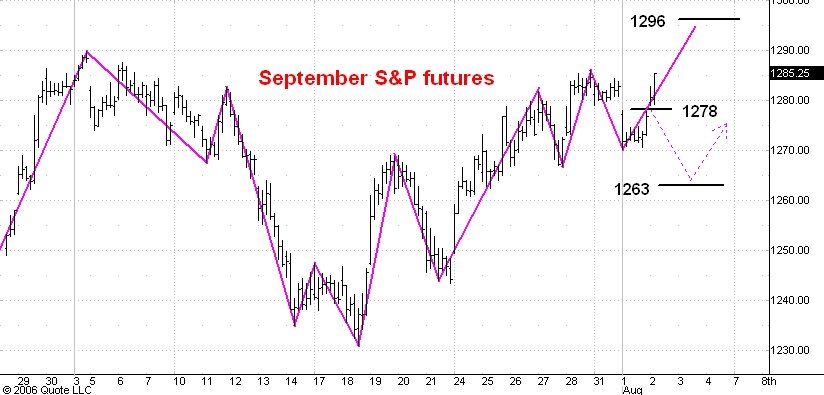
Here is an hourly chart of the September S&P e-mini futures. I commented on this chart yesterday.
I thought that the market would drop to 1263 in a three phase correction. Instead today is has traded almost two hours above what I thought would be the top of the second phase at 1278. This means that the correction is over and that the S&P's are headed for the next upside target at 1296.
This is the second time in a week that a break in the S&P's ended before a clear three phase structure was visible. I think this is telling us that the market is much stronger than commonly believed and that much higher prices lay ahead.
No comments:
Post a Comment