Here is an hourly chart of the September S&P e-mini futures. I last commented on this chart here.
In this morning's guesstimate I said that I thought the market would exceed my original 1296 target and make it up to 1299 before breaking 10-20 points. In the event the high tick so far has been 1297.75 and the market afterward has dropped as low as 1280.50.
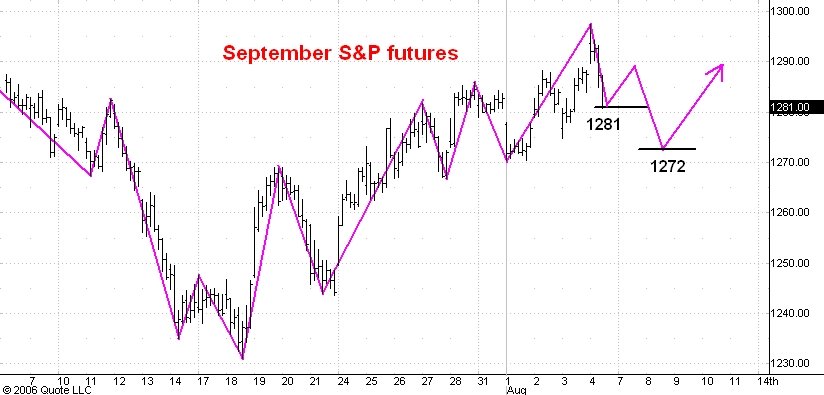
The reaction so far has been almost exactly as big as the reaction earlier this week from 1286 to 1270.25 so I think it is reasonable to expect a bounce upward to 1288 or so.
This bounce should be the second, upward phase of a three phase correction which I think will end near 1272 early next week. A drop from 1298 to 1272 would be a drop almost equal to the drop on July 20-21 from 1269 to 1243.50.
Once this brief corrective phase is complete I expect to see the market rally into the 1315-20 zone. I also think that by the end of the year we shall see the S&P's trading near 1420.
No comments:
Post a Comment