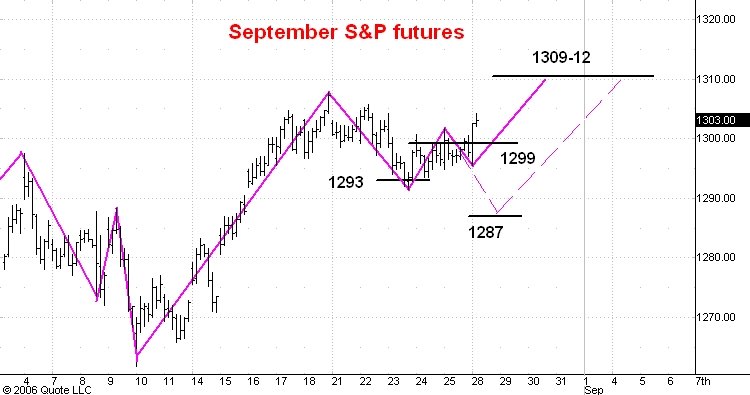
Here is an hourly chart of the September S&P e-mini futures. I last discussed this chart here.
I had expected the market to break below the lows of the last two days and continue to 1287. Instead, this mornign the market staged a decisive upside breakout from the same range. Support is now at 1299 and as long as this level holds I shall think that the market is now headed up into the 1309-12 zone. From there a break of 20-25 points is likely the move to new bull market highs resumes.
No comments:
Post a Comment