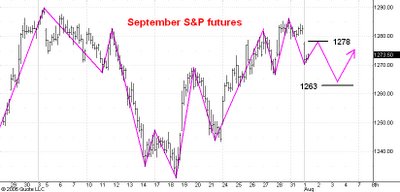
Here is an hourly chart of the September S&P e-mini futures. I last commented on this chart Friday.
The market has dropped almost three points below the 1273 support level I cited in this morning's guesstimate. Moreover, the drop from the 1286 high still looks like only the first phase of a normal three phase correction. So I think we shall see a rally to 1278 or so as the second phase and then a final drop to 1263 which will end the third phase of the correction.
Once this correction is over I expect to see the S&P's rally to another temporary top near1296. I still think that the 1229 low of June 14 will hold and that we shall see the S&P's trade at 1350 or higher by the end of this year.
No comments:
Post a Comment