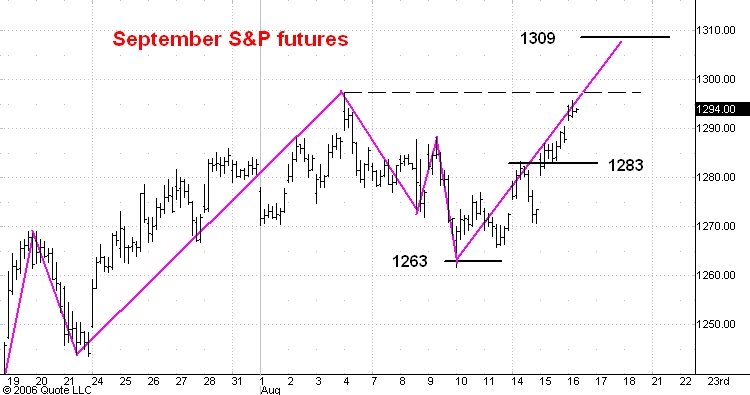
Here is an hourly chart of the September S&P e-mini futures. I last commented on this market here.
The market is very close to its last top (dashed line) at 1297.75. It would be typical behavior for the futures to take a brief peek above 1297.75 and then drop 10-15 points before resuming their move to 1309. In any event I see support at 1283, the last top on the way up.
No comments:
Post a Comment