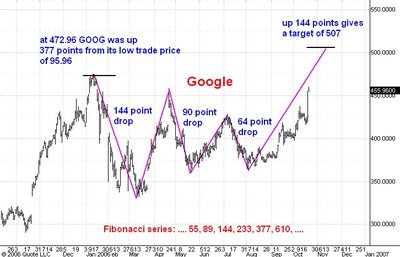
Here is daily chart of Google. I last commented on GOOG here.
After yesterday's close GOOG released a very favorable earnings report. The news sent the stock a few points higher that it was on April 21, the last time such a good report was released. This gives us an unusual opportunity to compare price action at similar levels and in a similar news context.
On April 21 GOOG had traded as high as 455 on the earning's news, then opened on the Nasdaq near 450 and sold off the rest of the day. It closed April 21 near 437, about 13 points under the open and 18 points under its high for the day. Let's watch GOOG today. It traded as high as 460.71 before the open. A drop of 18 points from there would take the market to 442 or so. If GOOG can stay above that level today the market will be telling us that it is in a more bullish condition than it was on April 21 which began a 100 point break.
I think GOOG will hold up well today and will soon be trading at new bull market highs above 475.
Postscript - at 4 pm ET: GOOG closed less than a point from its high today. This is very bullish action!
1 comment:
good point! incase somebody wants to short it..and get run ob=ver by a traing.
Thanks
Matt
Post a Comment