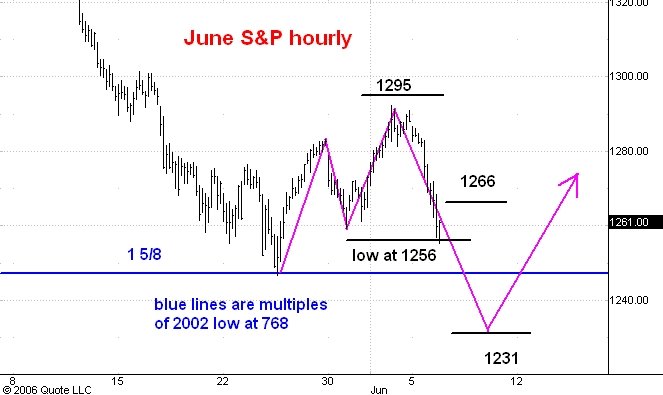
Here is an hourly chart showing regular hours trading in the June S&P e-mini futures. I last commented on this chart here.
The market has taken a peek below the last important low made in electronic trading at 1256 on May 31. Since we have seen virtually a straight line, 30 point drop in little more than a day's trading I think this is the spot where one be looking for a normal rally within the downtrend. How big is normal? Well, the preceeding rally within this down swing which is visible on the hourly chart was from 1281 to 1291 on June 2. So I would expect a rally of 10 points or a little more before the break resumes. On this basis I calculate resistance above the market to be at 1266.
No comments:
Post a Comment