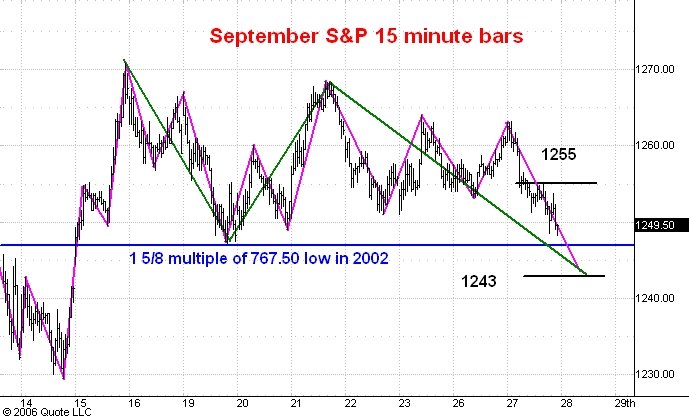
Here is a 15 minute bar chart showing regular hours trading in the September S&P e-mini futures since the June 14 low at 1229. I last commented on this chart here.
As you can see the market has spent most of the day trading below what I thought would be support at 1255. This tells me that we are now in the third phase of a three phase correction from the 1270.75 high on June 15. I have drawn the phases of this correction in green.
Right now I am expecting a low in the 1240-43 range and I think it will be followed by a move to 1282. I still expect to see the 1350 level later this summer.
No comments:
Post a Comment