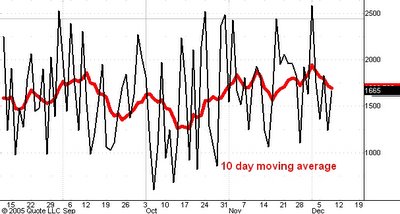

Here is a chart of the daily count of the number of issues on the New York Stock Exchange which advance in price (black line) and the 10 day moving average of the same number (red line).
With 30 minutes to go in today's trading session the black line is visibly higher than it was at yesterday's close despite the fact that the market today made a low below yesterday's low as you can see in the S&P cash chart above.
This divergence is a sign of strength and is telling me that the market will move well above 1280 after it reaches support at 1255 in the March '06 futures.
No comments:
Post a Comment