
Here are updated hourly and daily charts for February '06 gold futures.
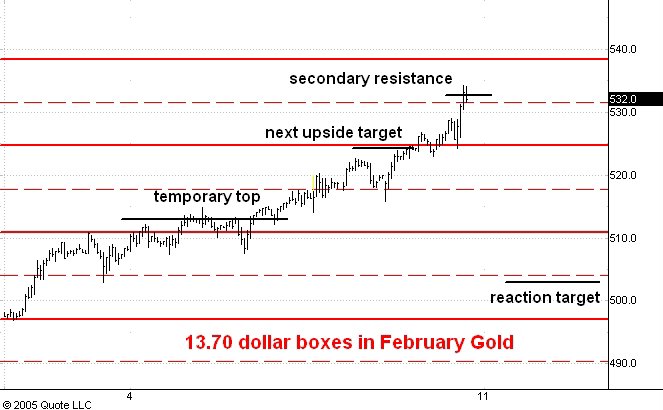
The market has proven stronger than even my optimistic estimates suggested. In the hourly chart above which shows pit and electronic trading I have drawn the $13.70 trading boxes that I have been using since the May low at $410. I have also shown (in black) the short term resistance and support levels I have calculated recently.
At the moment gold is trading well above the 524-26 zone which itself was the short term target after 513. I think the market is trading at very strong resistance right now and I don't expect it to close above secondary resistance at 532 before it reacts to support at 502.
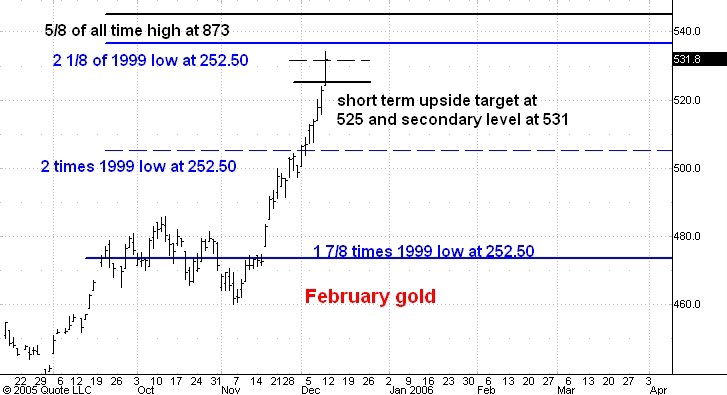
The daily chart shows in blue and in black the longer term resistance levels I have calculated using the all time high in gold futures at 873 in 1980 and the 1999 low at 252.50. In my experience the levels which are "1/8's" but not "1/4's" are the most useful ones for this sort of calculation. You can see two of them nearby at 535 and 545. This is another reason I expect a prolonged stall in gold to begin at current levels and at least a reaction of $40-50.
In fact I still think we may be seeing the end of the bull market in gold. But for the moment I don't see a compelling reason to to insist on this point.
No comments:
Post a Comment