
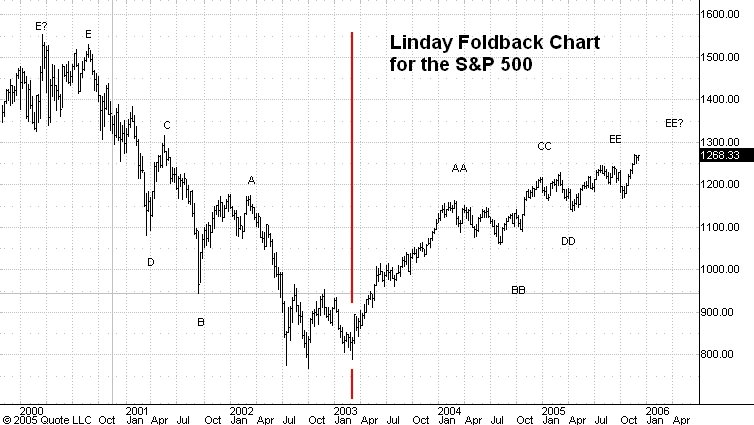
Here is an updated weekly chart of the cash S&P 500 since the March 2000 top at 1553.
I learned the technique of foldback charts from George Lindsay. I last commented on the chart you see above here. You will also find a description of the foldback idea in that post.
The symmetry point for this chart is the March 12, 2003 low. Each important high before that date predicts a high after that date. Each important low before that date predicts a low after that date. The predicted turning points are as many days after the symmetry point as the corresponding highs or lows were before the symmetry point. In this chart the highs and lows before March 12, 2003 are labeled with single letters while the corresponding predictions are labeled with the same letter doubled.
At this juncture I think the market is headed for a top at EE, predicted by the March 2000 top labeled E. The date for this predicted top is March 1, 2006. This is a full 2 months before the prediction generated by the Three Peaks and Domed House which started from the January 2005 top. We'll just have to look for more clues of the impending bull market top as the rally proeceeds into 2006.
No comments:
Post a Comment