Wednesday, June 21, 2006

S&P


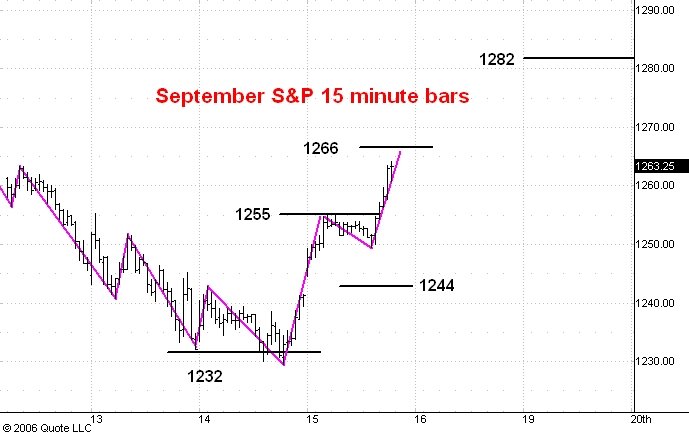
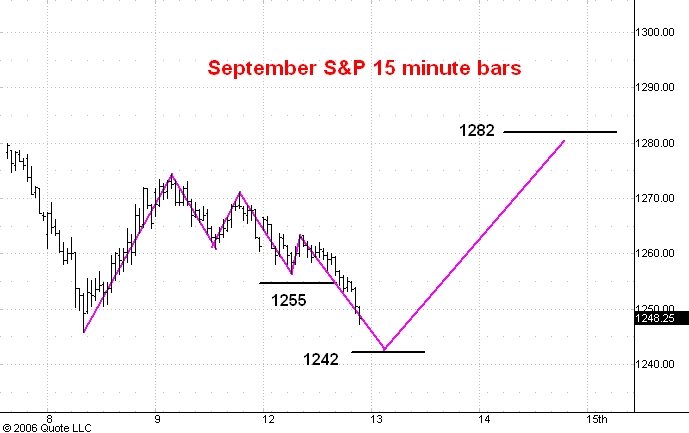
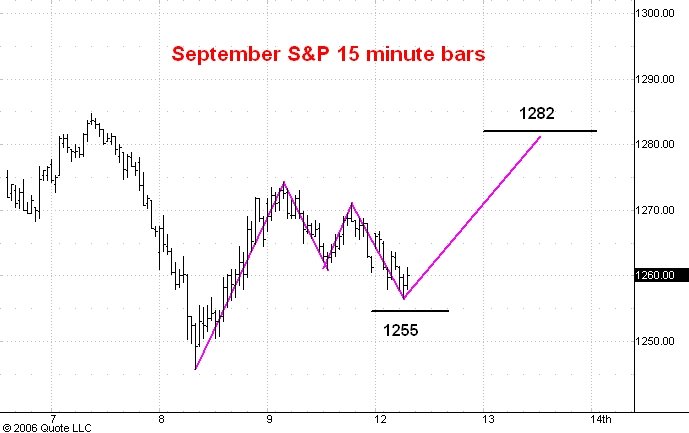
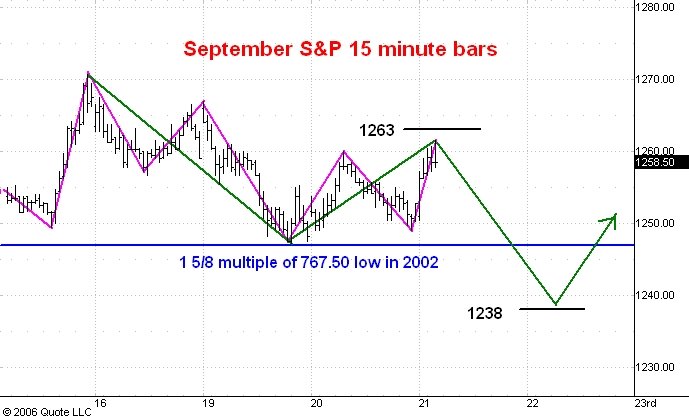
Here is a 15 minute bar chart of regular hours trading in the September S&P e-mini futures. I last commented on this market here and later in this morning's guesstimate.

In this morning's guesstimate I said that I thought yesterday's rally was probably only the second phase of a three phase correction instead of the start of a move to 1282 which was my view yesterday.

The strong rally after today's pit open carried the market above yesterday's high, but the entire move up from 1247.25 to 1261.50 looks like a three phase rally. I am going view it as such unless the market shows strength above the 1263 level. If I am right about this then the rally which started from Monday's low is only the second phase of a three phase drop from 1270.75. This in turn means that the market will soon start a drop to the third phase low which I expect to develop around 1238.

Once the correction from the 1270.75 level ends I am expecting a move up to 1282. I still think we shall see the S&P at 1350 this summer.

Guesstimates on June 21, 8:50 am ET

September S&P Futures: I now think yesterday’s rally was only the second stage of a three stage drop from 1270. This implies that the market is headed for support at 1243. The odds are 50-50 that it will reach a slightly lower target near 1238. After this low is established the next step up should be to 1282. I think the market ended the drop from the May 5 top at last week’s 1229 low. A move to new bull market highs is underway.

September Bonds: I think support at 106-04 has held and that the market is headed up to 107-24. Over the next few weeks the market should reach the 110-111 zone.

September 10 Year Notes: Support at 104-16 has held and the notes are now headed back up to 106-04. I expect the market to rally over the next few weeks into the 107-108 zone.

Euro-US Dollar: The move up from yesterday’s low looks like the third phase of a three phase rally which should end near 126.80. The next step down will carry the market to 124.30. An extended drop which should carry below 116 is underway.

Dollar-Yen: The yen has bounced of support near 114.30 and now should rally to 117.00 short term resistance. The market is in the early stage of a move to 130.

August Crude: The market should reach 66.50 soon. Resistance today is again at 70.80.

August Gold: Gold has completed a three phase rally to resistance and now will probably drop to a more important low in the 530-35 range.

July Silver: Silver still has a shot at 1066 but that would complete a three phase rally to resistance and be followed by a drop to a more important low in the 920-30 range.

Google: Support is at 380 and I think GOOG will soon rally to 410. I expect to see the market reach the 450-500 zone this summer.

Tuesday, June 20, 2006

Silver


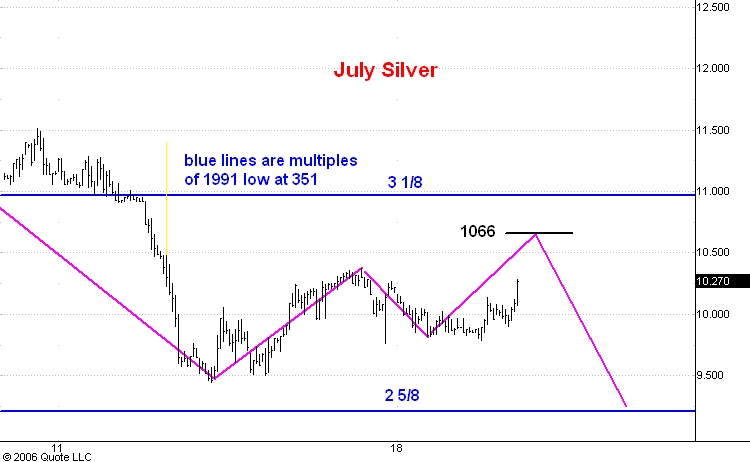
Here is an hourly chart showing pit and electronic trading in July silver futures. I last commented on silver here.

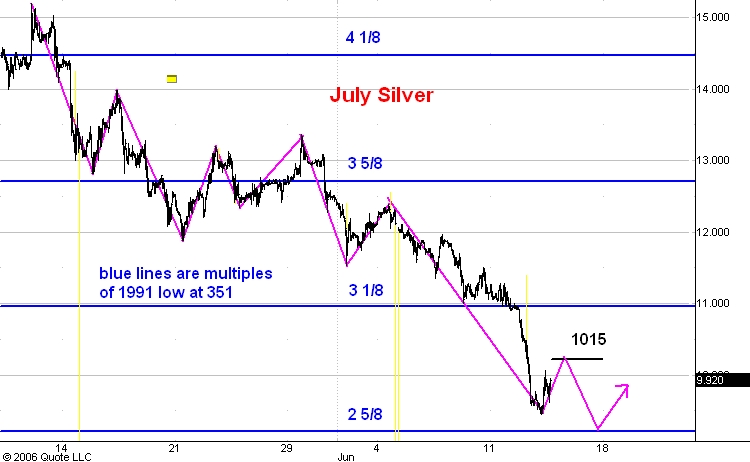
I think silver has begun the third phase of a three phase rally which now looks likely to end near resistance at 1066. After this third phase up move is complete I expect a drop to 920 or so which is the 2 and 5/8 multiple of the 1991 low of 351.

Once the 920 level is reached I think we will see a rally in silver of between two and three dollars.

Gold


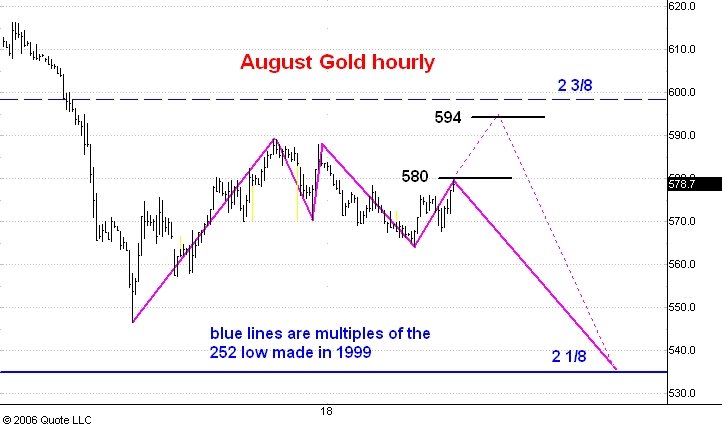
Here is an hourly chart showing pit and electronic trading in August gold futures. I last commented on gold here.

I think gold is in the process of putting in an important low near the 535 level which is the 2 and 1/8 multiple of the 252 low made in 1999.

Right now I think the 580 level is resistance, but if the market breaks above there then I will expect continuation up to 594. In either case the next significant move should be a drop into the 520-535 zone. After that I think a rally of about $100 will be a reasonable expectation.

S&P 11:30 am EDT


Here is an updated 15 minute bar chart showing regular hours trading in the September S&P e-min futures. I commented on this market about an hour ago.

I think the market has broken decisively above what I see as resistance near 1256. The rally from yesterday's low at 1247.25 is now the biggest rally since the 1270.75 top made last Thursday. These two facts mean that the drop from 1270.75 is over and that the market is now headed for 1282.

I am especially encouraged by the fact that this correction stopped exactly on the 1 and 5/8 multiple of the 2002 low at 767.50. The market has "climbed back on top" of long term support and this is another piece of evidence that the S&P's are headed for 1350 this summer.
S&P


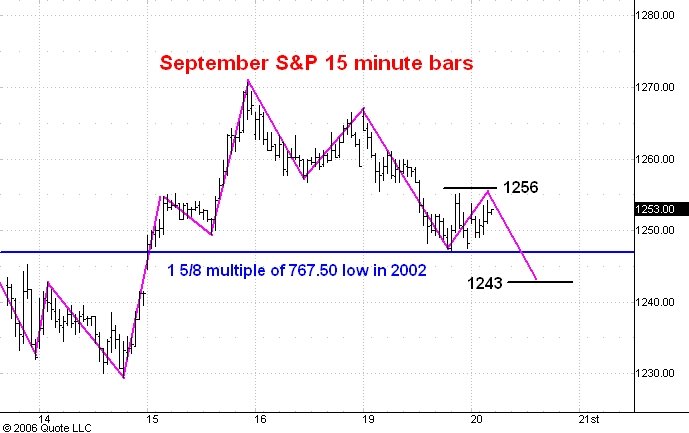
Here is a 15 minute bar chart showing regular hours trading in the September S&P e-mini futures. I last commented on this chart yesterday afternoon.

I think the market is about to stall at resistance near 1256 this morning and then drop to support near 1243. Once the low is in place I expect an upswing to 1282.

My longer term view is that last week's low at 1229 will hold and that the S&P's are headed up to 1350 this summer.
Guesstimates on June 20, 8:50 am ET

September S&P Futures: The market should drop to 1243 or so and then rally to 1282. I think the market ended the drop from the May 5 top at last week’s 1229 low. A move to new bull market highs is underway.

September Bonds: I think the market is headed for 106-04 before it rallies significantly. Over the next few weeks the market should reach the 110-111 zone.

September 10 Year Notes: The notes should continue down to 104-16. I expect the market to rally over the next few weeks into the 107-108 zone.  

Euro-US Dollar: I think the downtrend has resumed and that the market will soon reach the 124.30 level. An extended drop which should carry below 116 is underway.  

Dollar-Yen: The yen should find support near 114.30 and then rally to 117.00 short term resistance. The market is in the early stage of  a move to 130.  

August Crude: The market should reach 66.50 soon. Resistance today is again at 70.80.

August Gold: Gold has completed a three phase rally to resistance and now will probably drop to a more important low in the 530-35 range.

July Silver: Silver has completed a three phase rally to resistance and now should drop to a more important low in the 920-30 range.

Google:  Support is at 380 and I think GOOG will soon rally to 410. I expect to see the market reach the 450-500 zone this summer.

Monday, June 19, 2006

S&P Update


Here is a 15 minute bar chart showing regular hours trading in the September S&P e-mini futures.

In this morning's comment on this market I said that the break below support at 1261 meant that the market would drop to 1243. So far the S&P's dropped as low as 1247.25 but I think there is still a good chance that early tomorrow we will see the market closer to 1243 or even a bit below there. Any strength above 1256 would tell me that the drop from 1270.75 is over and that the market is headed for its next upside target at 1282.

I have also shown on this chart the 1 and 5/8 multiple of the 2002 low at 767.50 which stands at 1247. A low near there would be another very bullish indication because it will show that the market is "climbing back on top" of strong, long term support which was broken briefly on the way to last week's 1229 low.

15 minute bar chart of September S&P's

S&P

Here is a 15 minute bar chart showing regular hours trading in the September S&P e-mini futures. I last commented on this chart Friday.

In this morning's guesstimate I said that the 1261 level should be support today and that the market would soon rally to 1282. A short while ago the market broke decisively below 1261 so now I think that it is headed down to 1243. The drop from this morning's high at 1267 looks like the third phase of a three phase correction.

I still think the 1229 low made last week will hold and that the S&P will move to the 1350 level this summer.

Guesstimates on June 19, 8:50 am ET

September S&P Futures: I think the market ended the drop from the May 5 top at last week’s 1229 low. Support today is at 1261 and I think the market will rally to 1282 in a day or two. A move to new bull market highs is underway.

September Bonds: The bonds broke 106-28 support Friday so now I think the market is headed for 106-04 before it rallies significantly. Over the next few weeks the market should reach the 110-111 zone.

September 10 Year Notes: The notes broke below 104-30 support Friday and so should continue down to 104-16. I expect the market to rally over the next few weeks into the 107-108 zone.  

Euro-US Dollar: I think the downtrend has resumed and that the market will soon reach the 124.30 level. An extended drop which should carry below 116 is underway.  

Dollar-Yen: The yen is on its way to 117.00 short term resistance. The market is in the early stage of  a move to 130.  

July Crude: The market should reach 66.50 soon. Resistance today is again at 70.50.

August Gold: Gold has completed a three phase rally to resistance and now will probably drop to a more important low in the 530-35 range.

July Silver: Silver has completed a three phase rally to resistance and now should drop to a more important low in the 920-30 range.

Google:  Support is at 380 and I think GOOG will soon rally to 410. I expect to see the market reach the 450-500 zone this summer.

Friday, June 16, 2006

T-bonds


Here is an hourly chart showing regular hours trading in the September T-bond futures. I last commented on this market here.

I think the bonds are in the middle of a three phase drop from the 108-16 level. This correction should carry the market to support at 106-04. Meantime I am expecting a second phase rally from support at 106-28 to resistance near 107-20.

I think there is a very good chance that the May low at 105-06 in the September contract will be the low for 2006. In any event I expect the bond futures to trade into the 110-111 range over the next few weeks.

S&P


Here is a 15 minute bar chart showing regular hours trading in the September S&P e-mini futures. I last commented on this chart yesterday afternoon.

In this morning's guesstimate I said that the S&P would probably drop to support at 1255. The first hour price action shows a steady drop to 1261.25 and I now think the market is about to turn upward and rally to 1275. From resistance near 1275 I am expecting to see a three phase correction like the one I have illustrated in the chart. My guess right now is that the correction will probably carry the S&P's down to 1250 or so, but I would not be surprised by a bigger drop than that. Even so I expect the 1229 low to hold and to see the market over 1350 this summer.
Guesstimates on June 16, 8:50 am ET

September S&P Futures: I think the market ended the drop from the May 5 top at 1229 Wednesday. 1266 resistance was hit and slightly exceeded yesterday and today I think the market will probably react to support near 1255.  Resistance above yesterday’s high is at 1275. A move to new bull market highs is underway.

September Bonds: The bonds have nearly reached support at 106-28 but the move down looks like only the first phase of a three phase correction. I expect a rally to 107-20 or so followed by a third phase drop to 106-04. Over the next few weeks the market should reach the 110-111 zone.

September 10 Year Notes: The notes stopped at 104-30 support yesterday and will probably stage a second phase rally to 105-16. Then the drop from 106-04 will resume and end near 104-18. I expect the market to rally over the next few weeks into the 107-108 zone.  

Euro-US Dollar: I still think this market has a good shot at reaching the 126.90 level before it drops to 124.30 which is the next short term downside target. An extended drop which should carry below 116 is underway.  

Dollar-Yen: The yen should hold support around 114.30 and then rally to 117.00 or so. The market is in the early stage of  a move to 130.  

July Crude: The market should reach 66.50 soon. Resistance today is again at 70.50.

August Gold: Gold has completed a three phase rally to resistance and now will probably drop to a more important low in the 530-35 range.

July Silver: Silver has completed a three phase rally to resistance and now should drop to a more important low in the 920-30 range.

Google:  Support is at 380 and I think GOOG will soon rally to 410. I expect to see the market reach the 450-500 zone this summer.

Thursday, June 15, 2006

S&P Update


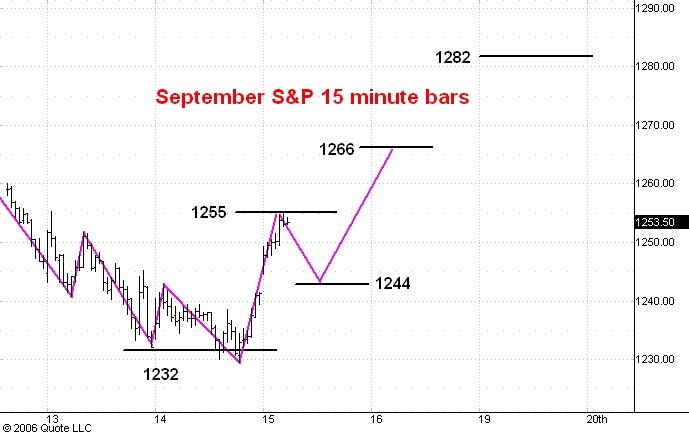
Here is a 15 minute bar chart showing regular hours trading in the September S&P e-mini futures. I commented on this chart this morning.

I thought that the market would react from 1255 to 1244 but it only made it to 1249.50, thus showing even more strength than I had anticipated. It is now approaching the 1266 resistance level. There the move up from 1229 would equal the length of the intial move up of about 37 points in the June contract from the low on May 24 at 1245.75 to the high on May 26 at 1283.50.

My best guess now is that any reaction from 1266 will hold in the 1250-55 zone.

S&P


Here is a 15 minute chart showing regular hours trading in the September S&P e-mini futures. I last commented on this chart here.

The market has reached the intial resistance level at 1255 which I mentioned in this morning's guesstimate. My best guess now is that we will see a reaction down to 1244 or so followed by a rally to 1266. This activity in turn is part of what I think is a bigger rally to 1282.

I think yesterday's 1229 low will hold and that we will see the S&P above 1350 this summer.
Guesstimates on June 15, 8:50 am ET

September S&P Futures: I think the market ended the drop from the May 5 top at 1229 yesterday. Support today is at 1238 and I think the market will rally at least to 1255 today and possibly higher. This in turn should be the first phase of a move to new bull market highs.  

September Bonds: The bonds have nearly reached support at 106-28 but the move down looks like only the first phase of a three phase correction. I expect a rally to 107-20 or so followed by a third phase drop to 106-04. Over the next few weeks the market should reach the 110-111 zone.

September 10 Year Notes: The notes broke well below 105-10 today in what looks like only the first phase of a three phase correction. Support is at 104-30 and a second phase rally should reach 105-16. I expect the third phase low to develop around 104-20. I expect the market to rally over the next few weeks into the 107-108 zone.  

Euro-US Dollar: I still think this market has a good shot at reaching the 126.90 level before it drops to 124.30 which is the next short term downside target. An extended drop which should carry below 116 is underway.  

Dollar-Yen: The yen should hold support around 114.30 and then rally to 117.00 or so. The market is in the early stage of  a move to 130.  

July Crude: The market should reach 66.50 soon. Resistance today is at 70.50.

August Gold: Gold has completed a three phase rally to resistance at 582 and now will probably drop to a more important low in the 530-35 range.

July Silver: Silver has completed a three phase rally to resistance near 1015 and now should drop to a more important low in the 920-30 range. Resistance above the market today is at 1015.

Google:  Support is at 380 and I think GOOG will soon rally to 410. I expect to see the market reach the 450-500 zone this summer.
Wednesday, June 14, 2006

S&P Update


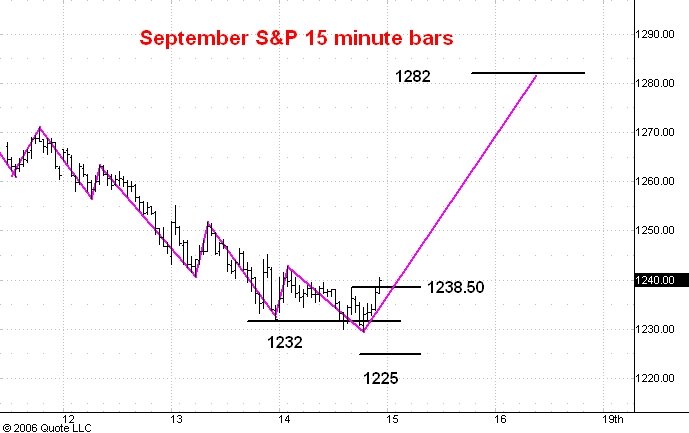
Here is a 15 minute bar chart of the June S&P e-mini futures. I discussed this chart in a post about an hour ago.

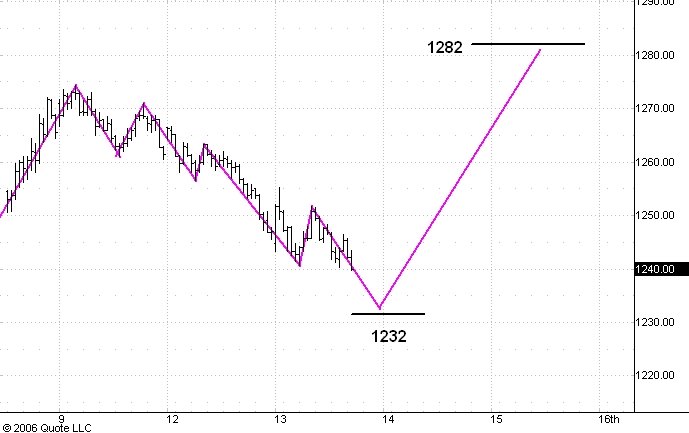
Instead of a quick break to 1225 the market held 1232 support a fifth time and then, more importantly, rallied above the last reaction high which stood at 1238.50. This is the most bullish price action in almost a week and I think it means that the 1229 electronic low this morning will hold and that the market is on its way to 1282.

S&P


Here is a 15 minute bar chart of regular hours trading in the June S&P e-mini futures. I last commented on this chart yesterday.

By my count (which includes electronic trading not shown on this chart) the market has staged four big rallies from the 1232 level yet we are down there again now. I think this means that support at 1232 has been exhausted and that the S&P's will now make a quick trip to 1225. I still think a big rally will develop from there, probably to the 1282 level.

Advancing Issues


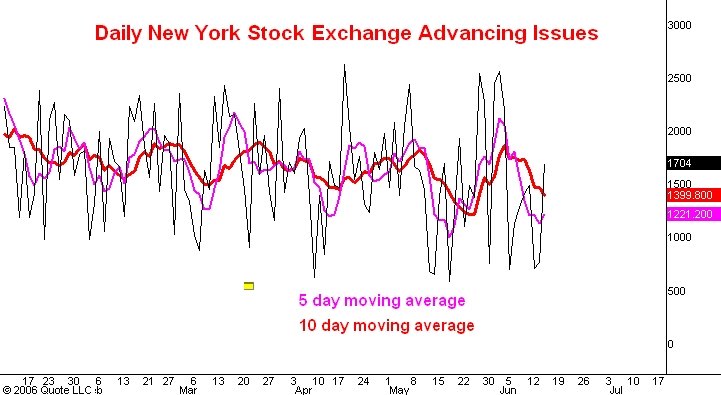
Here is a daily line chart showing the count of the number of issues traded on the New York Stock Exchange which advance in price each day (black line). The pink line is the 5 day moving average of this number while the red line is the 10 day moving average. I last commented on this chart here.

The most important thing to notice about this chart is that while the market averages have dropped below the lows made on May 24 both the 5 and 10 day moving averages have remained above the lows they established then. This is a classic bullish divergence. I think it is particularly important at this juncture because the drop in the S&P from its May 5 high has equalled the biggest corection of the bull market so far (March-August 2004, about 100 points).

It is also interesting to note that today the daily number is showing (so far) an upward zig-zag, breaking above its last high made on June 9.

All in all I think this indicator now has powerfully bullish implications.

Gold


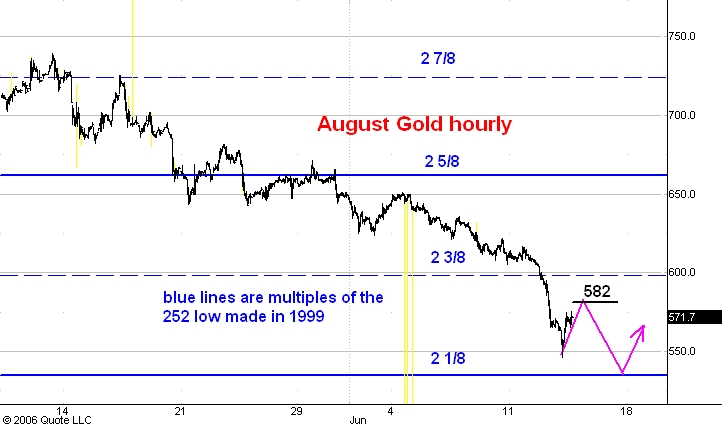
Here is a highly condensed hourly chart showing pit and electronic trading in August gold since its May top at 739. I last commented on gold here.

I have been expecting the break from the May top to halt, at least for a while, near the 2 1/8 multiple of the 252 low made in 1999. This is the 535 level. This morning gold made it to 546 and I think it started a three phase rally from there to 582 or so. Then I will be expecting a drop to 535 followed by a bigger rally, perhaps of $100 or so.

Silver


Here is a highly condensed hourly chart showing pit and electronic trading in July silver futures during the drop from its May top of 1520. I last commented on this market here.

I have been expecting silver to drop to 935 which is just a tad above 921, the 2 5/8 multiple of its 1991 low at 351. This morning silver got as low as 942. I think we will now see a classic three phase rally to 1015 or so. After that I expect the market to drop to 920. I think the next development in silver will be a big rally of 2 or 3 dollars from the upcoming low.

Guesstimates on June 14, 8:50 am ET

September S&P Futures: The market has reached support at 1232 and I think the next move will be upward to 1282. This in turn should be the first phase of a move to new bull market highs.  

September Bonds: I expect 108-12 resistance to hold. The market should now drop to 106-28. Over the next few weeks the market should reach the 110-111 zone.

September 10 Year Notes: The notes should hold resistance at 106-04 and then drop to support at 105-10. I expect the market to rally over the next few weeks into the 107-108 zone.  

Euro-US Dollar: I still think this market has a good shot at reaching the 126.90 level before it drops to 124.30 which is the next short term downside target. An extended drop which should carry below 116 is underway.  

Dollar-Yen: The yen has nearly reached 115.50 resistance and soon should break to support around the 114.30 level. The market is in the early stage of  a move to 130.  

July Crude: The market should reach 66.50 soon. Resistance today is at 69.25.

August Gold: Gold has nearly reached my 535 target which is the 2 and 1/8 multiple of the 252 low. Resistance above the market is at 582.

July Silver: Silver has nearly reached my 935 target. Resistance above the market today is at 1015.

Google:  Support is at 380 and I think GOOG will soon rally to 410. I expect to see the market reach the 450-500 zone this summer.
Tuesday, June 13, 2006

S&P Update


Here is a 15 minute chart of the September S&P e-mini futures. I last commented on this chart this morning.

The market has spent the entire day so far bouncing off of 1242 support but I think it is about to break lower, this time to 1232. I still think the market will rally to 1282 once 1232 is reached.

S&P


Here is a 15 minute chart of the September S&P e-mini futures. I last commented on this chart here.

In electronic trading before this morning's open the market dropped as low as 1239.50. After the open it then rallied to 1255 but gave up all the gains by dropping again to 1241. The market is now rallying from this higher low at 1241. I think that a move to 1282 has begun.

Guesstimates on June 13, 9:15 am ET

September S&P Futures: The market has reached the 1242 downside target and I think the next move will be upward to 1282. This in turn should be the first phase of a move to new bull market highs.  

September Bonds: I expect 108-12 resistance to hold. The market should now drop to 106-28. Over the next few weeks the market should reach the 110-111 zone.

September 10 Year Notes: The notes should hold resistance at 106-04 and then drop to support at 105-10. I expect the market to rally over the next few weeks into the 107-108 zone.  

Euro-US Dollar: The market should hold temporary support at 125.70 and then rally to 126.90.  After that the next step down should carry to 124.30. An extended drop which should carry below 116 is underway.  

Dollar-Yen: The yen soon should reach the 115.50 level. The market is in the early stage of  a move to 130.  

July Crude: The market should reach 66.50 soon.

August Gold: The next step down should carry to 580. Downside target over the next few weeks remains the 2 and 1/8 multiple of the 252 low which stands around the 535 level.

July Silver: The market has broken below 1070 and is now on its way to the next temporary support around 995. Resistance above the market is at 1095. The 935 level should be reached in a couple of months.

.

Monday, June 12, 2006

S&P Update


Here is a 15 minute bar chart showing regular hours trading in the September S&P e-mini futures.

This morning I thought that the market had made its low at 1256.50 and would commence a rally up to 1282. Instead all that happened was a sideways movement of about 3 hours and then the S&P's broke completely throught the 1250-55 zone, my original target range for a higher low.

I now think that last week's low of 1245.75 will be be broken by a bit and that the market will drop to 1242 or so before beginning a move up to 1282.

S&P


Here is a 15 minute bar chart showing regular hours trading in the September S&P e-mini futures. I last commented on this market here.

In this morning's guesstimate I said that I expected the market to drop into the 1250-55 zone and then rally to 1282. So far this morning the market has dropped as low as 1256.50. I think I see signs that we won't make it even to 1255. So I am now assuming that the low for the day has been made and that the market is headed for 1282.

Bonds


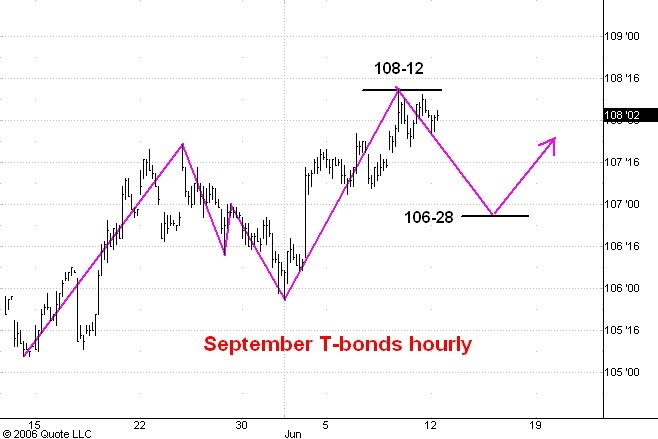
Here is an hourly chart showing regular hours trading in the September T-bond futures. I last commented on this market here.

As you can see the market has been stalling just underneath resistance at 108-12. I think this means that the next swing will be downward to higher support at 106-28. I still believe that the bonds will reach the 110-111 range over the next few weeks.

Yen and Euro


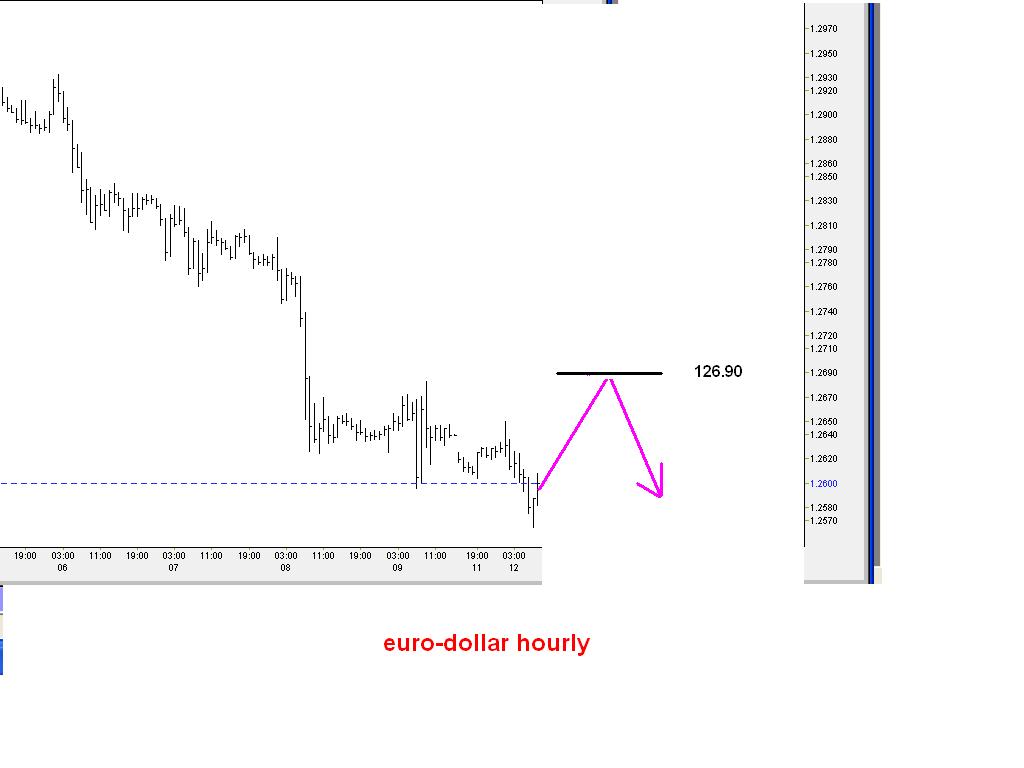
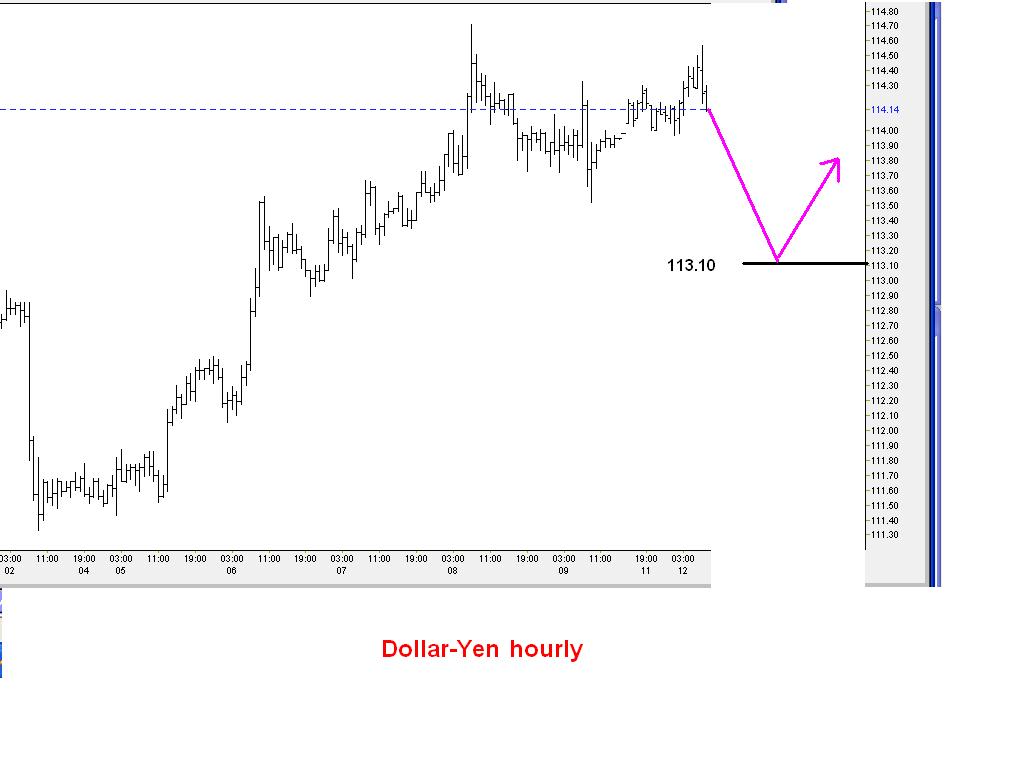
Here are hourly charts of the dollar-yen and euro-dollar currency pairs.

I think that the yen will drop to 113.10 or so before it rallies to 115.60. Similarly, it now looks like the euro-dollar will rally to 126.90 before dropping to 125.00 and lower.

Guesstimates on June 12, 8:50 am ET

September S&P Futures: I think the market will drop today into the 1250-1255 zone. After that a rally to 1282 is likely. In any case the low at 1245.75 should hold and the next big move should carry to new bull market highs.

September Bonds: The market should now drop to 106-28. Over the next few weeks the market should reach the 110-111 zone.

September 10 Year Notes: The notes couldn’t make it all the way to 106-08 and now are headed for support near 105-10. Over the next few weeks I expect the market to rally into the 107-108 zone.  

Euro-US Dollar: The market has reached  support at 125.70 but as yet shows no sign of a rally. Next step down should carry to 124.80. An extended drop which should carry below 116 is underway.  

Dollar-Yen: The yen soon should reach the 115.50 level. The market is in the early stage of  a move to 130.  

July Crude: Resistance today is at 72.50. The market should reach 66.50 soon.

August Gold: The next step down should carry to 594. Downside target over the next few weeks remains the 2 and 1/8 multiple of the 252 low which stands around the 535 level.

July Silver: The market is on its way to 1070. Resistance above the market is at 1145. The 935 level should be reached in a couple of months.

Google: Google is on its way to 410, the next upside resistance. Support now is at 380. I think Google will rally into the 450-500 range this summer.  

Sunday, June 11, 2006

Nattering Nabobs of Negativity


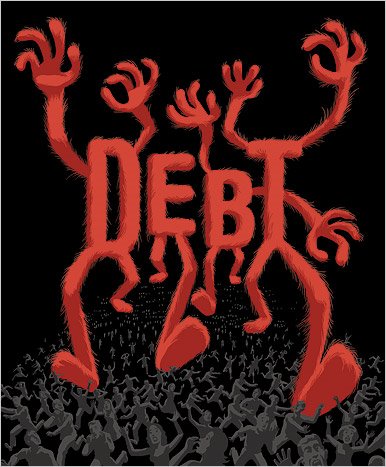
Well, The New York Times is at it again. Above this post you will see the cover of this week's New York Times Magazine. It depicts the debt bogeyman coming to get you. Its colors are the classic colors of fear, red on black. To the left of this post you will also see some artwork which accompanies the cover story. It depicts Uncle Sam as Gulliver being tied down by the Lilliputians with ropes of debt.

What are we to make of this? Well certainly the NYT is continuing its downbeat propaganda compaign that tries to convince its readers that the US economy is in trouble. But my theory of the big media is that they are in the business of telling people what they want to hear. So this story is good evidence that, at least among the elite in the USA, there is a lot of negative sentiment about the US economy and its prospects. As far as I am concerned this means that no significant drop in stock prices is likely for the forseeable future.

I note also that the bogeyman of debt is a contrary opinion signal that the US bond market is headed up from here. And I think it that Gulliver/Uncle Sam is telling us that the US dollar is headed up too.

Friday, June 09, 2006

S&P Update


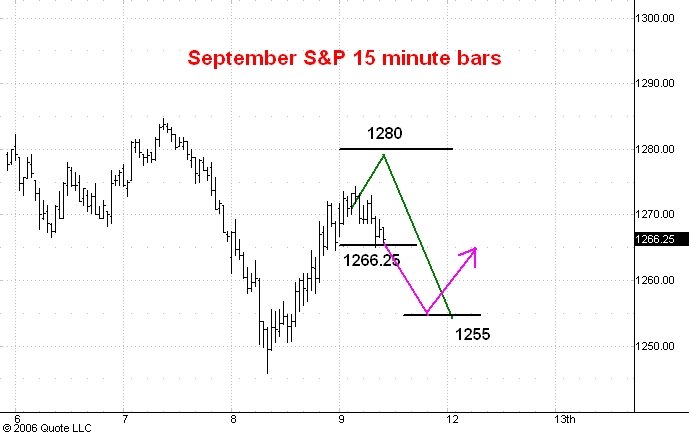
Here is an updated 15 minute chart of the September S&P e-mini futures. I commented on this chart earlier this morning.

I think the market is about to break below support at yesterday's close of 1266.25. If it does then the next stop will be roughly the 1255 level from which a rally to 1280 should develop.

S&P


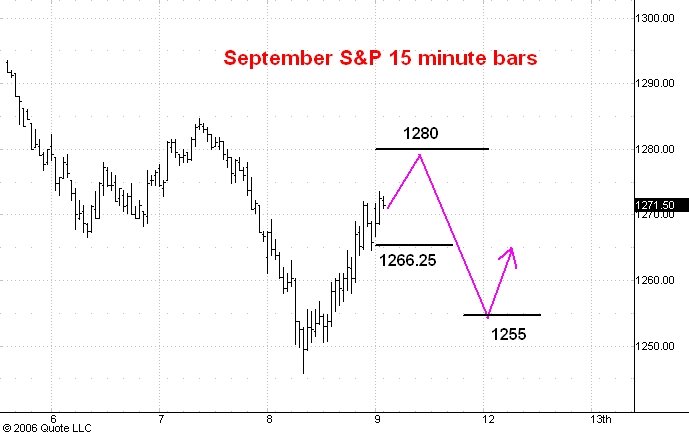
Here is a 15 minute bar chart showing regular hours trading in the September S&P e-mini futures. I last commented on this market here.

In this morning's guesstimate I said that I thought the market was stalling in the 1268-70 zone and would drop early today to 1255 or so and then rally. The market's early action has changed my mind about this.

The key fact is that the early break from the 1271 opening price stopped at 1266.75, just above the last tick of yesterday's regular hours trading at 1266.25. I had expected a quick drop to negative territory for the day, but since it hasn't happened I now think that the S&P's will move up to the 1280 level before the first significant reaction occurs.

Guesstimates on June 9, 8:50 am ET

September S&P Futures: The S&P’s appear to be stalling in the 1268-70 zone. I think the market will drop early today to 1255 or so and then finish the day strong. In any case yesterday’s low at 1245.75 should hold and the next big move should carry to new bull market highs.

September Bonds: Bond bounced off of 108-12 resistance yesterday and should now drop to 106-28. Over the next few weeks the market should reach the 110-111 zone.

September 10 Year Notes: The notes couldn’t make it all the way to 106-08 yesterday and now are headed for support near 105-10. Over the next few weeks I expect the market to rally into the 107-108 zone.  

Euro-US Dollar: The market is on its way to 125.70.  Resistance is at 128.10. This should be only the first stage of an extended drop.

Dollar-Yen: Support today is at 113.60 and the yen soon should reach the 115.50 level. The market is in the early stage of  a move to 130.  

July Crude: Resistance today is at 71.20. The market should reach 66.50 soon.

August Gold: The market has reached temporary support near 610 but I think the 624 level is resistance.  The next step down should carry to 594. Downside target over the next few weeks remains the 2 and 1/8 multiple of the 252 low which stands around the 535 level.

July Silver: The market is on its way to 1070. Resistance above the market is at 1145. The 935 level should be reached in a couple of months.

Google: Google is suddenly showing strength in the face of a falling market. I am giving up on my 344 target and am looking for 410 as the next upside resistance. Support now is at 380. I think Google will rally into the 450-500 range this summer.  
Thursday, June 08, 2006

Advancing Issues


Here is a daily line chart recording the number of issues traded on the New York Stock Exchange that advance in price each day. I last commented on this chart here.

Today the major averages made new lows for the drop from the May 5 top. But as you can see on the chart above neither the daily count of advancing issues nor its 5 or 10 day moving averages made new lows today.

This is a bullish divergence and is more evidence that the 1235 level in the cash S&P (1245.75 in the September futures) marked the end of the correction.

Bull Market Boxes in the S&P 500


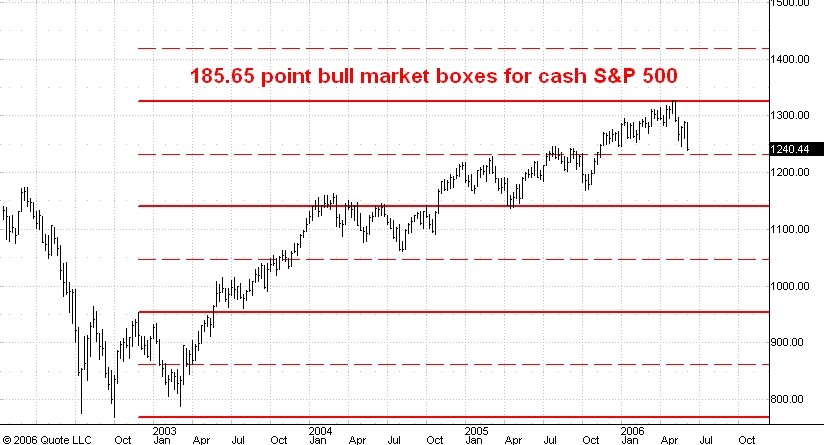
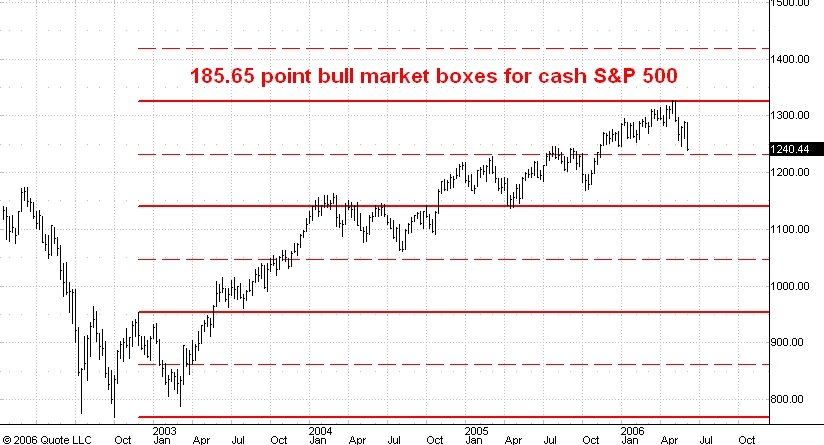
Here is a weekly chart showing the bull market boxes for the cash S&P 500. I haven't applied my box theory on this blog for quite a while because it is a lot of work preparing the charts. But I think this example nicely illustrates the basic principle. The box size of 185.68 points was defined by the size of the first rally off of the bear market low at 768.63 in October of 2002.

My theory is simply that reactions and rallies during the subsequent bull market tend to begin and end at the box boundaries (which are multiples of 185.68 points up from the 2002 low) as well as at the midpoints of these boxes. Normally bull and bear markets are more likely to end at the midpoint of a box instead of at the top or bottom. This is one reason why I think that the drop from the 1326 high in the cash S&P is corrective and will be followed by new bull market highs.

Note that the midpoint of the current box in the cash S&P is at 1232.75. I think today's low in the cash S&P of 1235.18 ended the reaction from the 1326 level. In any case the next midpoint above the market stands at 1418 and I think there is a good chance that we will see the S&P close to that level later this year.

S&P Update


Blogger has been down all day and I haven't been able to post for several hours until just now.

Here is an updated hourly chart of the September S&P e-mini futures. I last commented on this chart here.

I had been expecting a low near 1241 in the September contract. In the event the market made it down to 1245.75 and has since rallied sharply. I think we have seen the low of the drop from the May 5 top (1342.75 in the September contract). As soon as the market moves above the 1285 level (the last reaction high on the way down to the low) we will have added evidence that the low has been made.

Sometime during the next couple of trading days I would expect to see a reaction down into the 1250-57 range. My best guess right now is that it will start from resistance which I think stands near 1280.

S&P


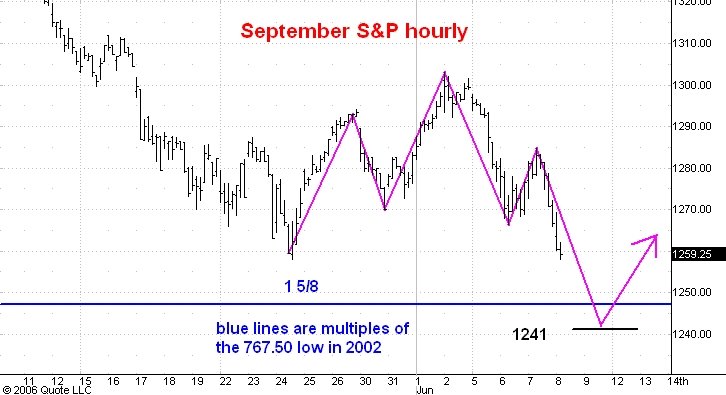
Here is an hourly chart showing regular hours trading in the September S&P e-mini futures. I am switching into the September contract today and it is trading about 10 points higher than the June contract. I last commented on the June contract here.

Within a day or two the S&P's should hit my 1241 downside target. I think this will end the move down from the 1331 top in the June contract made May 5. The 1241 target would make the entire reaction in the cash market about 95 points in length which equals the length of the March-August 2004 drop, the biggest reaction since the March 2003 low.

Once the upcoming low is in place I expect the market averages to move visibly above their May highs. This up move should take most of the summer.

Guesstimates on June 8, 8:50 am ET

September S&P Futures: Switching to the September contract today; it is trading about 10 points over June. Resistance today is at 1268. The S&P’s are on their way to 1241.

September Bonds: Bond are on the way to 108-12. Over the next few weeks the market should reach the 110-111 zone.

September 10 Year Notes: The notes are on the way to 106-08. Over the next few weeks I expect the market to rally into the 107-108 zone.

Euro-US Dollar: The market is on its way to 125.70. Resistance is at 128.10. This should be only the first stage of an extended drop.

Dollar-Yen: The yen is headed for 115.50. The market is in the early stage of a move to 130.

July Crude: Resistance today is at 70.60. The market should reach 66.50 soon.

August Gold: The market is headed downward to temporary support at 610. Resistance above the market is at 630. Downside target over the next few weeks remains the 2 and 1/8 multiple of the 252 low which stands around the 535 level.

July Silver: The market is on its way to 1070. Resistance above the market is at 1170. The 935 level should be reached in a couple of months.

Google: Google is suddenly showing strength in the face of a falling market. I am giving up on my 344 target and am looking for 410 as the next upside resistance. Support is at 369. I think Google will rally into the 450-500 range this summer.

Wednesday, June 07, 2006

NYSE Group


Here is a chart of the New York Stock Exchange Group. I last commented on NYX here.

I think NYX has made its post-merger low at 55.38 and is now headed to the 1 and 5/8 multiple of that low at 90, just a shade below its all time high so far of 91.35.

Chicago Merchantile Exchange


Here is a daily chart of the Chicago Merchantile Exchange. I last commented on CME here.

I think CME has established the low of the reaction from the 500 level on support near 418 which is the 10 and 1/8 multiple of the all time low of 41.35. I think the market will now take CME to the 13 and 1/8 multiple near the 540 level.

Board of Trade


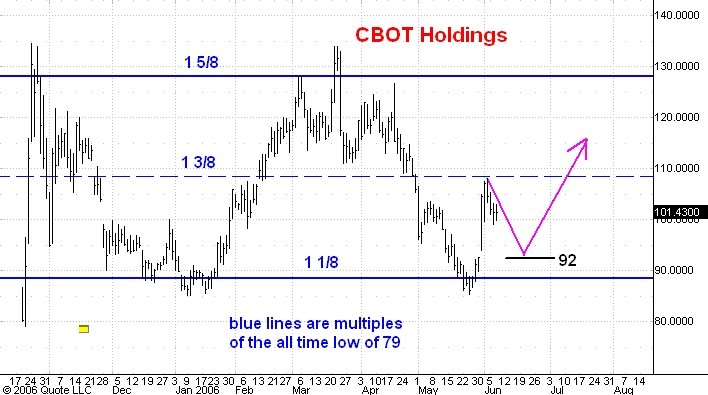
Here is a daily chart of Cbot Holdings. I last commented on BOT here.

I think BOT has established its low for the drop from the 134 high of March 22. I think the next development will be a reaction to 92 or so which will be followed by a strong upmove. I still think that a move to 168 which is the 2 1/8 mutiple of the post IPO low of 79 is a reasonable expectation.

Baidu


Here is a daily chart of Baidu.com. I last commented on this chart here.

BIDU is performing even better than GOOG is relative to the market averages. Today it made a new high for the move up from its post IPO low at 44.44. I now think it will continue upward at least to the 2 and 5/8 mutliple of this low at the 116 level. If this relative permormance continues and if the averages make new bull market highs this summer as I expect we may well see BIDU trading at 160.

Google


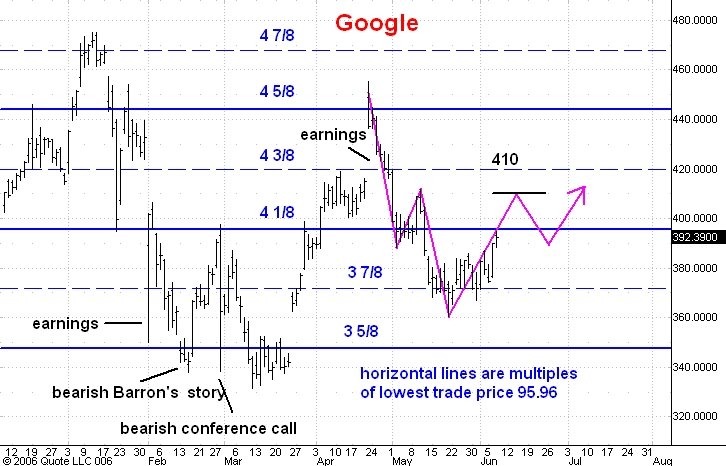
Here is a daily chart of Google. I last commented on GOOG here.

I had been thinking in terms of a 344 downside target for GOOG. But over the last couple of days the stock has outperformed the market dramatically. Note that it is now visibly higher than the 387 high of June 2, the day that the S&P's traded as high as 1294. On the other hand the S&P's are still 20 points below their corresponding high.

This is yet another example of "the dog that didn't bark principle". Whenever an individual stock starts showing a pattern of lows and highs that is remarkably different that the pattern of the averages it is time to reassess your market views.

In the case of GOOG I now think that the reaction low was made at the 360 level and that it will move into the 450-500 zone this summer. Meantime the 410 level is my initial upside target which may be followed by a break of 20 points or so.
S&P


Here is an hourly chart showing regular hours trading in the June S&P futures. I last commented on this chart here.

Tomorrow the September contract will move to the top step and become the most active contract. September is trading about 10 points above June.

In this morning's guesstimate I revised my estimate of resistance upward a bit from 1266 to 1268. The market has traded as high as 1270.75 this morning but I am not ready to give up on 1268 yet. I will say though that a move as high as 1275 would lead me to conclude that the market is headed to 1300 or so. This is turn would cast doubt on the 1231 target because as I have pointed out here there is a lot of bearish sentiment in this market.

Guesstimates on June 7, 8:50 am ET

June S&P Futures: Resistance today is at 1268. The S&P’s are on their way to 1231.

September Bonds: Bond are on the way to 108-12 but right now will probably dip to 106-31 before resuming their advance. Over the next few weeks the market should reach the 110-111 zone.

September 10 Year Notes: The notes are on the way to 106-08 but first will probably dip to support at 105-10. Over the next few weeks I expect the market to rally into the 107-108 zone.

Euro-US Dollar: The market is on its way to 125.70. Resistance is at 128.10. This should be only the first stage of an extended drop.

Dollar-Yen: The yen is headed for 114.40. The market is in the early stage of a move to 130.

July Crude: The market looks ready to break decisively below 71.80 support and when it does it should reach 66.50 in a couple of weeks.

August Gold: The market is headed downward to temporary support at 610. Resistance above the market is at 630. Downside target over the next few weeks remains the 2 and 1/8 multiple of the 252 low which stands around the 535 level.

July Silver: The market is on its way to 1070. Resistance above the market is at 1170. The 935 level should be reached in a couple of months.

Google: Google is suddenly showing strength in the face of a falling market. I am giving up on my 344 target and am looking for 410 as the next upside resistance. I think Google will rally into the 450-500 range this summer.

Tuesday, June 06, 2006

S&P Update


Here is an updated hourly chart showing regular hours trading in the June S&P e-mini futures. I commented on this chart earlier this morning.

The market rallied a bit above resistance at 1266. Since this was only a normal rally, just slightly bigger than the previous rally, I think that the next step down should carry the S&P's down into the 1242-1245 range, just a little below the May 24 low at 1246.75.

US Dollar


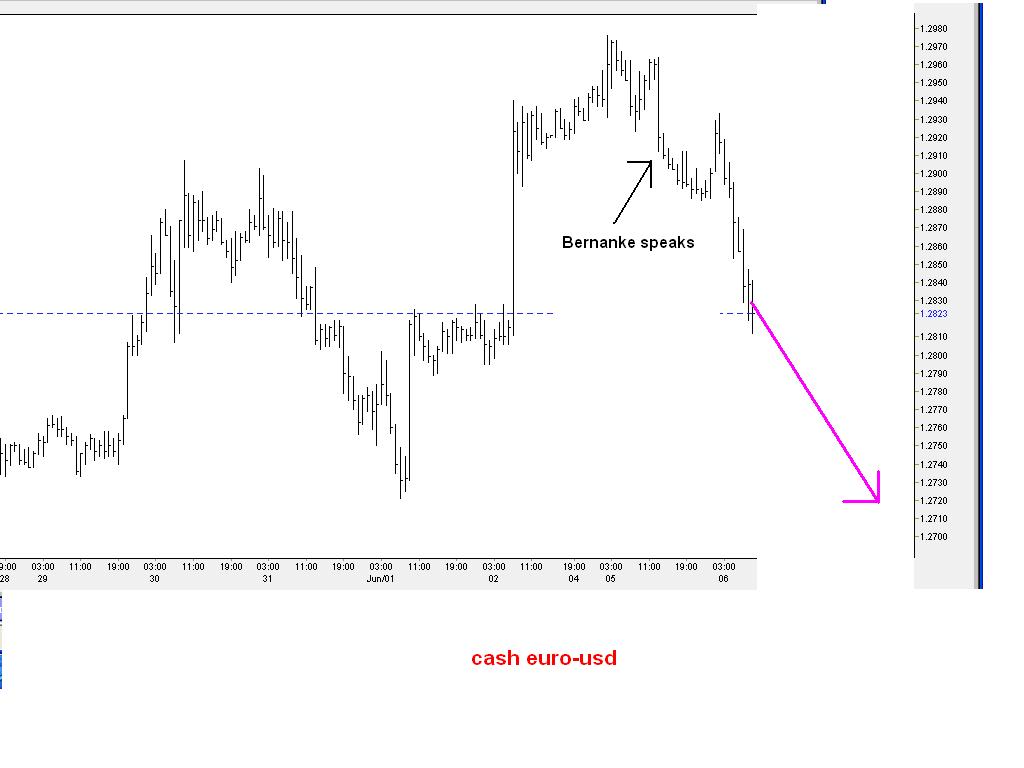
Here is an hourly chart of the cash euro-US dollar pair. I last commented on this market here.

Unlike the bond market, the euro-usd seems to be taking Bernanke seriously by dropping sharply after his speach (so that the dollar is rising against the eurocurrency).

This divergent behavior of the dollar and the bond market after the Bernanke speech makes me think that the key factor now behind the dollar movement is more fundamental than interest rate expectations. Take a look at the latest article in The Economist magazine about their "Big Mac" index. It shows that on a purchasing power parity basis the euro is very overvalues against the dollar.

So I am sticking with my longer term forecast that the euro-usd will drop below 116 during the second half of this year.

S&P


Here is an hourly chart showing regular hours trading in the June S&P e-mini futures. I last commented on this chart here.

The market has taken a peek below the last important low made in electronic trading at 1256 on May 31. Since we have seen virtually a straight line, 30 point drop in little more than a day's trading I think this is the spot where one be looking for a normal rally within the downtrend. How big is normal? Well, the preceeding rally within this down swing which is visible on the hourly chart was from 1281 to 1291 on June 2. So I would expect a rally of 10 points or a little more before the break resumes. On this basis I calculate resistance above the market to be at 1266.

The Dog That Didn't Bark


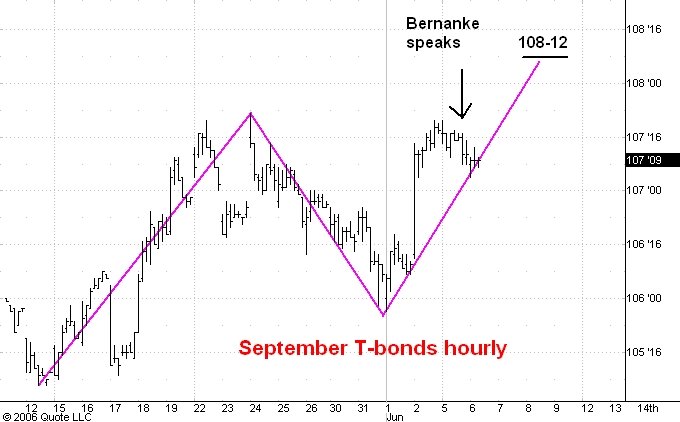
Here are hourly charts showing trading in the September T-bond futures.

One of the most important and effective clues to the underlying trend of any market is what I like to call "The dog that didn't bark". I have discussed this idea on this blog here and here .

Yesterday Fed Chairman spooked the markets by pledging vigilance against inflation according to the front page of the Wall Street Journal. This was interpreted as a hint that Bernanke intended to raise rates further instead of pausing as the markets had hoped.

One would think that such news would send bond prices much lower. But as you can see on the hourly chart of the T-bond futures the bond market hardly noticed. This dog didn't bark. And I think this is yet another piece of evidence of strength that is telling us that the bond market is headed much higher from here. At the minimum I would expect the futures to reach the 110-111 zone over the next couple of months. There is even a very good chance that the May 15 low will turn out to be the low for all of 2006 in the bond market.

Guesstimates on June 6, 8:50 am ET

June S&P Futures: The S&P’s are on their way to 1231.  Resistance today is 1275.

September Bonds: Bond are on the way to 108-20. Support today is 106-06. Over the next few weeks the market should reach the 110-111 zone.

September 10 Year Notes: The notes are on the way to 106-08. Support today is 105-10. Over the next few weeks I expect the market to rally into the 107-108 zone.  

Euro-US Dollar: The market is again trading well below 129.20 resistance so I conclude that a move to 125.70 is underway. This should be only the first stage of an extended drop.

Dollar-Yen: The yen is again trading well above the 111.70 level so I think it is now headed for 114.40. The market is in the early stage of  a move to 130.  

July Crude: The market has dropped back to the 71.80 level which is now short term support. A break below 71.80 would force me to give up my current 74.20 target. In any case crude should be trading at 66.50 in a couple of weeks.

August Gold: The market is headed downward to temporary support at 610. Downside target over the next few weeks remains the 2 and 1/8 multiple of the 252 low which stands around the 535 level.

July Silver: The market is on its way to 1070. The 935 level should be reached in a couple of months.

Google: I think Google will drop to 344 and then rally into the 450-500 range this summer.  

Monday, June 05, 2006


June S&P hourly

S&P

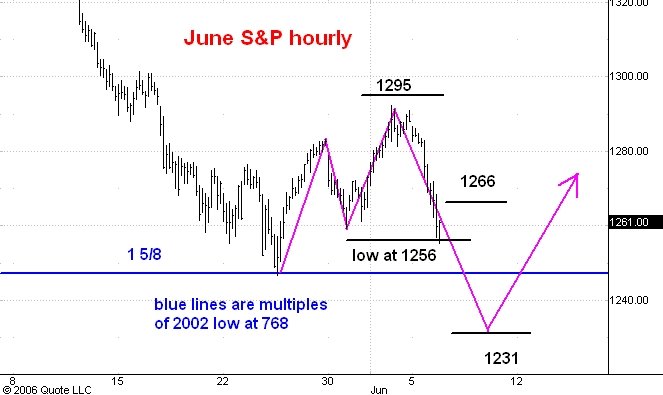
Here is an hourly bar chart showing regular hours trading in the June S&P e-mini futures. I last commented on this market here.

The market has accelerated below short term support at 1281 and is now headed for the 1231 level. I think that will mark the end of the correction which started from the May 5 top at 1331. From there I expect a rally to new bull market highs which will carry the S&P's into the 1350-1400 zone. My best guess is that this rally will last most of the summer.
The Barron's Opinion Indicator


As you know I lean heavily on my evaluation of state of popular opinion when trying to estimate markets' longer term trends. The principal input for this analysis is my file of clippings from newsmagazines and major newspapers. My theory is that the news media are in the business of telling people what they want to hear; in other words they cater to people's prejudices and to popular opinion. So if you want to understand whether public opinion is bullish or bearish about a certain market you have to look for headlines, cover stories, or other articles that affirm the public's feeling of optimism or pessimism.

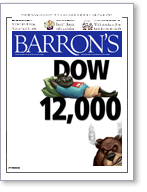
Barron's is a weekly financial newspaper published by Dow Jones. I thought you might like to see three Barron's covers I clipped for my files so far in 2006. I have to say that I cannot remember a 6 month period during the past 40 years during which I have clipped as many as 3 Barron's covers for my contrary opinion file.

The first cover is the Google cover I discussed in this post and in this one. The second cover was for the May 1 issues and shows a contented bull resting on the Dow 12000 marker. In retrospect I should have paid more attention to this cover. The third cover appears on this week's issue of Barron's . It shows a smiling Jimmy Rogers having the last laugh. Rogers has been a big commodities bull for almost 10 years now and commodity prices have soared over the past year.

Given Barron's record of identifying tops and bottoms I think this week's cover is telling us that commodities prices will be falling on average for at least another year.

Lest I give you the impression that fading Barron's covers is the sure road to wealth I want to mention the Barron's cover that remains as fresh in my memory as it was the day it was published. This was the cover of a late August 1982 issue and was published just a couple of weeks after the start of a bull market that carried the Dow from 777 to 11750 over the next 18 years. It depicted a snorting bull!!!

Guesstimates on June 5, 8:50 am ET

June S&P Futures: The S&P’s have nearly reached 1295 resistance. I think the next significant move from here will be downward to 1235 or so. A drop below 1281 will signal that this move has begun.

September Bonds: Bond are on the way to 108-20. Over the next few weeks the market should reach the 110-111 zone.

September 10 Year Notes: The notes are on the way to 106-08. Over the next few weeks I expect the market to rally into the 107-108 zone.

Euro-US Dollar: The market has broken above 129.20 resistance and should now rally further to 130.60. I still think the next significant move from here will be downward from there.

Dollar-Yen: The yen broke below 111.70 support and so should continue a little lower to 110.70. From there the next swing should be upward to 114.40. The market is in the early stage of a move to 130.

July Crude: The market broke above resistance at 71.80 late Friday and should now continue to 74.20 before it turns lower. After this rally crude should head down to 66.50.

August Gold: Resistance today is at 650. The market should soon head downward to temporary support at 610. Downside target over the next few weeks remains the 2 and 1/8 multiple of the 252 low which stands around the 535 level.

July Silver: Silver bounced off of temporary support near 1160. 1235 is resistance today and the market should now drop to 1100. The 935 level should be reached in a couple of months.

Google: I now think Google will drop to 344 and then rally to new bull market highs.

Friday, June 02, 2006

Baidu


Here is a daily chart of Baidu.com. I last commented on BIDU here.

I think BIDU is about to drop to the 69 level. From there I am expecting a rally into the 115-120 range as the averages make new bull market highs this summer.

Google


Here is a daily chart of Google going back to its all time high of 475 this past January. I last commented on GOOG here.

Google has been underperforming the averages all year and this underperformance is continuing. I had expected GOOG to rally to 410 by the time the S&P reached the 1295 level but we are still well shy of that.

So I think that GOOG will now drop further than my original 356 target to 344 or so. Then we should see a move up into the 450-500 range as the averages themselves make new highs for the bull market this summer.
S&P


Here is a 15 minute bar chart showing regular hours trading in the June S&P e-mini futures. I last commented on this chart here.

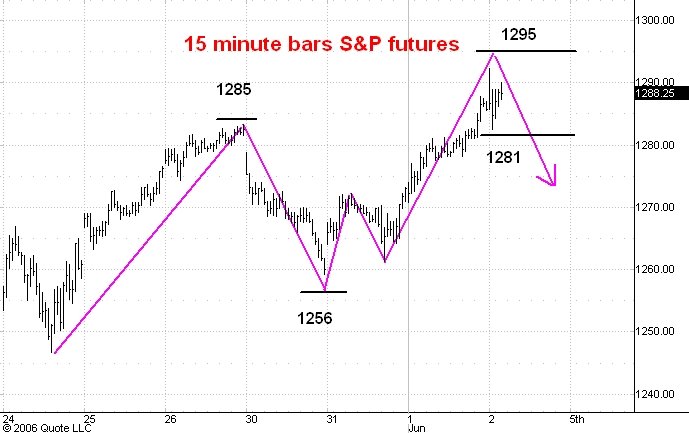
In electronic trading after the employment number this morning the market reached the 1294 level (not shown on this chart), just shy of 1295 resistance. I think we will trade between resistance at 1295 and support at 1281 for a day or two. I expect the market to break lower out of this projected trading range and reach the 1235 level. After that the bull market should resume and carry the S&P's into the 1350-1400 range.

Guesstimates on June 2, 8:50 am ET

June S&P Futures: The S&P’s have nearly reached 1295 resistance.  I think the next significant move from here will be downward to 1235 or so.

September Bonds: Bond are on the way to 108-20. Over the next few weeks the market should reach the 110-111 zone.

September 10 Year Notes: The notes are on the way to 106-08. Over the next few weeks I expect the market to rally into the 107-108 zone.  

Euro-US Dollar: The market is still stuck in a trading range. Resistance today is 129.20 and I think the next significant move from here will be downward.

Dollar-Yen: The yen should find support around the 111.70 level and then start upward to 114.40. The market is in the early stage of  a move to 130.  

July Crude: Today resistance is at 71.80. The market is headed down to 66.50 before another rally starts.

August Gold: Resistance today is at 650. The market should soon head downward to temporary support at 610. Downside target over the next few weeks remains the 2 and 1/8 multiple of the 252 low which stands around the 535 level.

July Silver: Silver bounced off of temporary support near 1160. 1225 is resistance today and the market should now drop to 1100.  The 935 level should be reached in a couple of months.

Google: I think Google will hold the low at 360 and rally to 410.

Thursday, June 01, 2006

S&P


Here is an updated 15 minute bar chart showing regular hours trading in the June S&P e-mini futures. I last commented on this chart here.

As you can see the market has broken visibly above the 1275 resistance level. This forces me to abandon my view that the market would drop to 1250 to complete a three phase reaction. Instead I now believe that we are headed up to 1295 to complete a three phase rally from the 1246 level. After 1295 is reached I think the S&P's will drop to 1235 or so.

T-bonds


Here is an hourly chart showing regular hours trading in the September T-bond futures. I last commented on this market here.

I think the bond market made an important low on May 15. The t-bond futures should rally about five points from there to roughly 110 or a little higher. In fact I think there is a better than even chance that the May low will prove to be the low for the year in the bond market.

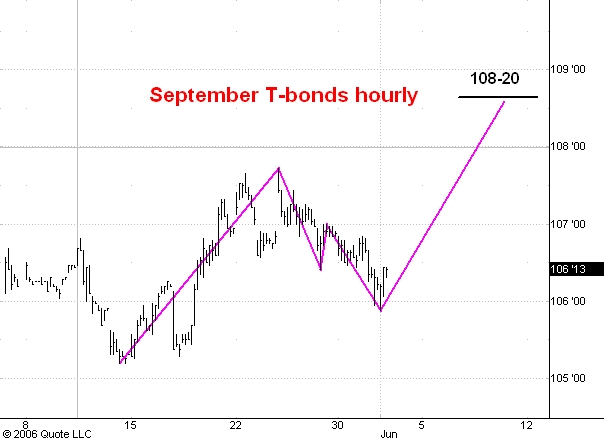
Even so, I am operating on the more conservative hypothesis that the move up from 105 is corrective and that it should thus evolve as a series of three phase rallies. I think the second phase of the first three phase rally was completed this morning at the 104-27 level in electronic trading. The third phase should carry the bonds to 108-20 or so.

After 108-20 I envision a three phase drop followed by another rally which will carry the market into the 110-111 zone.

Guesstimates on June 1, 8:50 am ET

June S&P Futures: I still think the market will now bounce off of resistance near 1275 and drop to 1250 or so.  After that a rally to 1295 should commence.

September Bonds: Switching today to the September contract. Support is at 106-00 and from there I expect a rally to 108-20 or so. Over the next few weeks the market should reach the 110-111 zone.

September 10 Year Notes: Switching today to the September contract. Support today is at 104-22.  I think the next development will be a rally to 106-08. Over the next few weeks I expect the market to rally into the 107-108 zone.  

Euro-US Dollar: The market is headed lower. Temporary support should be found near 126.30.

Dollar-Yen: The yen is now on its way to 113.60. The market is in the early stage of  a move to 130.  

July Crude: The market is headed down to 66.50 before another rally starts.

August Gold: Switching to the August contract. The market is headed for temporary support at 610. Downside target over the next few weeks remains the 2 and 1/8 multiple of the 252 low which stands around the 535 level.

July Silver: Silver is headed for temporary support near 1160. The 935 level should be reached in a couple of months.

Google: I think Google will hold the low at 360 and rally to 410.