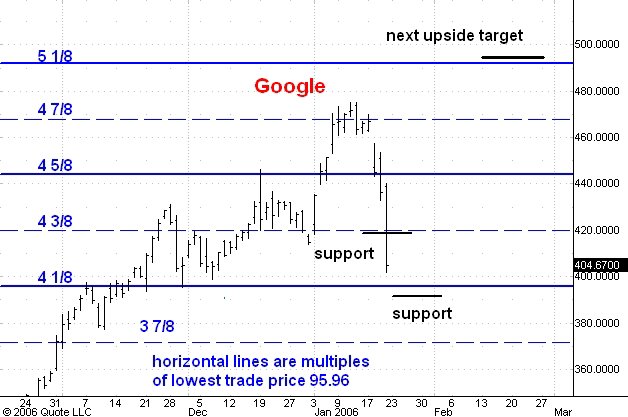
Here is an updated daily chart of Google.
Earlier today I said that GOOG would stop in the 415-420 zone but as you can see the market blasted right through there.
My next estimate is for a low in the 390-95 zone. I still think we will see 495 sometime during the next 2 or 3 months.
1 comment:
dear sir
i came to your blog via looking for information on george lindsey
i have been following the 3 peaks domed house pattern on a longer term perspective in both the dow as well as the nyse ( nya ) index
on weekly charts . there is a very compelling arguement to be made that point 23 has been reached in the nya index . the pattern began in 1997 . the may 2000 top was
point 5 . from there we had a basic decline into point 10 in oct 2002 . from oct 2002 the domed house began .point 15 was the march 2004 high . from there we got points 16 17 18 19 20 .
point 20 being aug 2004 .point 21 march 2005 top 22 may 2005 low
and point 23 is done now . this does not bode well for the other indexes . i am using a close only weekly chart as my refrence and the pattern looks textbook . iam not so sure on the time frames yet the pattern is very much complete
as of january 2006
Post a Comment