
Here is an hourly chart showing pit trading in the March S&P futures.
A little while ago the market dropped to 1262.50, just a shade above 1262 support. A close today above 1268 would convince me that the low is in. Otherwise we will probably see the 1259 level tomorrow before a rally to 1320 starts.
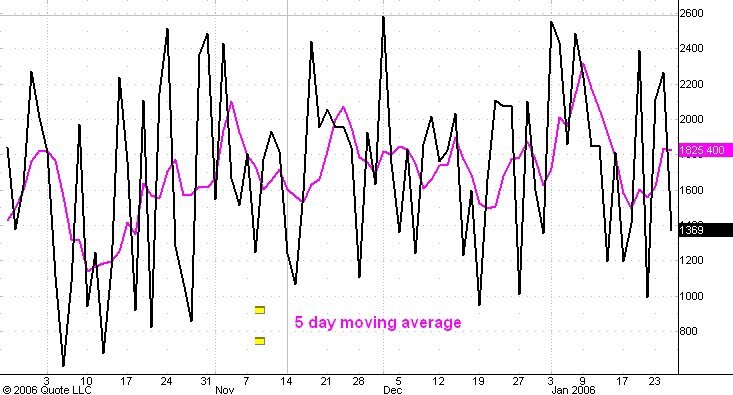
The second chart above this post shows the daily count (in black) of the number of New York Stock Exchange issues which advance in price and the five day moving average of this number (in purple).
Notice that both these lines are above the low levels reached last week while the S&P itself has dropped below last week's low. This positive divergence is another reason to think a big rally is about to begin.
No comments:
Post a Comment