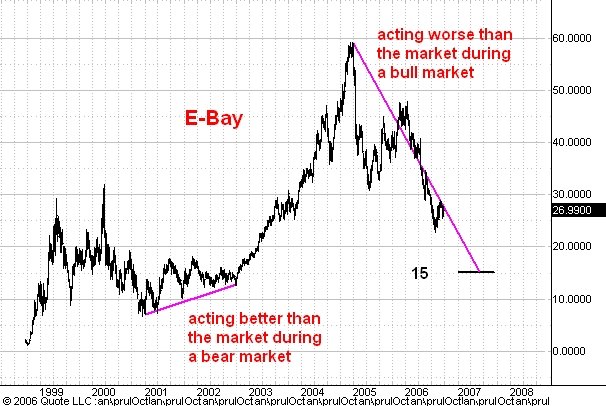
Here is a highly condensed weekly bar chart of E-bay. This is the first time I have commented on this stock and the reason is easily seen from its chart.
During a bull market one wants to own stocks that are keeping pace with or even outperforming the averages. But E-bay made its bull market high in January of 2005 when the S&P was trading around 1215. It has dropped substantially since then while the S&P has rallied to 1340. I think this underperformance will continue for a while and will drop E-bay to 15 or so.
Notice how the current situation contrasts with that of the 2001-2002 period. During those two years E-bay managed to rally in the face of a big bear market drop in the averages. This overperformance predicted the big bull run in E-bay which carried it from 15 to 58 during the next two years.
1 comment:
Thanks Carl - would it be possible to explain how you arrived at the 15 target?
I ask because if you look at the earnings numbers, they have gone up at a double digit growth rate EVEN in the last 2 years while the stock got cut in half. If they are indeed able to earn their expected $1/share, then getting to 15x would make this so called growth stock very cheap at those levels. Of course, this could happen easily if their $1 EPS is not met, or if the broader market PE falls. It would be enlightening to see the market achieve your target inspite of the above so called fundamentals!
Post a Comment