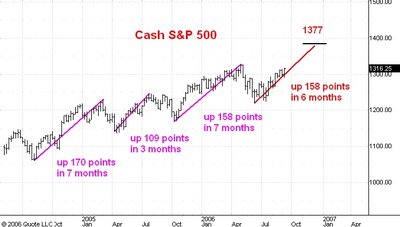
Here is a weekly chart of the cash S&P 500 index. I want to use it to illustrate a simple minded but effective technique for estimating the probable length of any trend.
The objective of any such estimate is to get you "in the right ballpark", the ballpark in which the extreme point of the trend will be playing. Making such estimates is as much art as science. But those who feel uncomfortable with the notion of speculation as an art should probably not be speculators.
In any event, the basic idea is to look for analogues of the current market situation in the market's recent history. At the moment I think that a strong uptrend has begun from a low point this past June. The June low (1219 in the cash S&P 500) occurred amidst oversold conditions and levels of public pessimism very comparable to the conditions which prevailed at the recent lows in August 2004, April 2005, and October 2005. On this basis I am willing to bet that the upmove from the June 2006 low will be comparable to the upmoves from one of these three previous lows.
In fact, I think that the level of bearish sentiment was so high at the June 2006 low that its closest analogues are the lows of August 2004 and October 2006. From each of these lows the market moved upward at least 158 points and the uptrend continued for at least 6 months. So I am willing to guess that the advance from the June low will carry upward at least 158 points (i.e to at least the 1377 level) and will last at least 6 months (i.e into December).
In fact I have been guessing that we shall see the S&P trade over the 1400 level by the end of the year. A move up from the June 2006 low that equals the August 2004-March 2005 advance in percentage terms would carry the S&P to 1414.
No comments:
Post a Comment