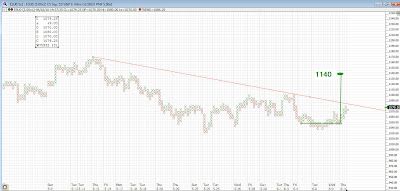
I think today's rally has very bullish implications. It has broken the pattern of 35 point reactions established during the last six weeks. The market has moved higher, retracing all of yesterday's break, without any apparent reason. Against the backdrop provided by the very bearish attitude of the public towards stocks I think this action means the market is headed much higher from here.
On the five point box point and figure chart you see above I have counted across the very well defined base area that has formed during the past 4 days (horizontal green line). This count yields an upside target of 1140. Attaining the 1140 level would represent a breakout from the much bigger base (which "counts" to well above 1300) that began near the May 25 low. It would also carry the market well above the descending trend line I have drawn. Today's activity leads me to believe that a breakout from this "up to 1140" base is underway. Such a breakout means that much higher prices (to and above 1300) will be seen during the next six months.
9 comments:
Carl
no answer to this question at this point yet here is thought .
What is the common ratio of time with in each 3 peaks domed house patterns in the past looking at all formations . n ext is taking the time factor up a simple plus 1 day or plus 1 week versus down week down day down month ect...
next is correlating them for basic time and price data .
example : 30 min dow
TIMES: PST
point 1 may 25 2010 0630
point 3 may 26 2010 0730
point 5 may 27 2010 1230
point 7 june 3 2010 0630
point 8 9 10 june 8 2010 0730
point 11 12 13 14 june 8 2010 1200
since this is a smaller pattern
and since most 3 peaks fail to make a new high , then at best we are heading to point 15 which can be strong but we should not make a new high . just averages .
end points to consider . 16 yrs 3 months ago to 15 years 3 months ago and look at indicators at that time. dec 1994-1995 ???
Point :E on this 30 minute chart ?
then convert ratio to larger scale and make a basic form . it is a guide is all to see the larger scale in a smaller scale time .
looking at up bars down bars regardless of price is very helpful
I do expect ES eventually back at 1220, but I think today's rally is a bunch of hot air. New weekly options were introduced this week. Tomorrow is the first weekly options expiration, open interest on calls outweighs that of puts after today. SPY has a gap to fill at 106.57. Furthermore SPY 109.35 is strong resistance. Finally I don't believe the low of this correction/pullback is in yet until we say a day of panic selling with volume greater than the flash crash day of 600M. I don't know what the low will be but I'm watching the volume. I like Carl's previous estimate of ES 1000-1020.
Yep,Yep were in a bull market. My call tommorow is for the markets to trade in the 1000 to 1150 range.
Always happy to see strong buying!
1090--1066 too..tomorrow.
Blog is fantastic,and thank you to issue revised guess estimates and
as usual taking control over the market.
I am so thankful,Sir.
I see 1043/1041 June 11 with 1029/1026 and 1012 down below. Only way this scenario is not valid is if we close on the daily tommorrow past 1107.50 or past 1094
In watching Carl the last 3-4 months, I have seen many times his earilier predictions come spot on. Example He was predicting the 1020-1004 area, but now has changed.
I still believe he is correct, but with his earlier forecast.
The up and down moves always coming down tells me a bigger move is forthcoming but to the upside.
A daily close below 1041 will take us to 1029/1026 and 1012. I do not expect a daily close below 1012 even if it touches 1004 area and the daily close once these lower numbers are reached will probably be above 1012 and above 1041.
Then we should see a pattern like Feb 5 to April 16.
if 1140 is attained would be poss rs for hs daily
Carl your revised guess estimates were positively brilliant. Thanks
Tomorrow should be down. After all, the market needs to digest, without throwing up, the feast it pigged on today.
Day traders will need to think about Monday only after Friday is over.
Carl, I've asked several times before, and I'm going to ask again - how do you come to your predictions on precious metals?
The only thing I can see that would bring them down is if interest rates were strongly hiked, and given unemployment, and the large number of option ARMs that would experience even more severe payshock, that seems highly unlikely.
Is it purely technical? Really hoping you'll shed some light here.
Post a Comment