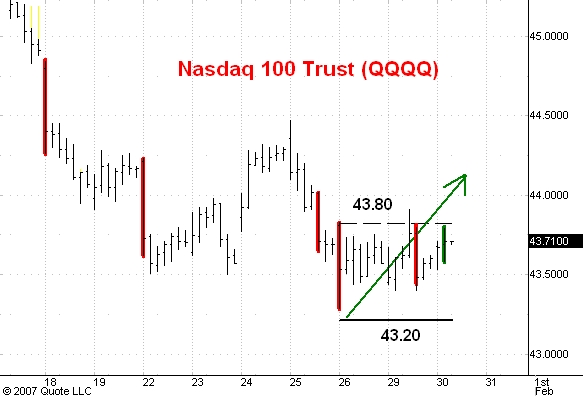
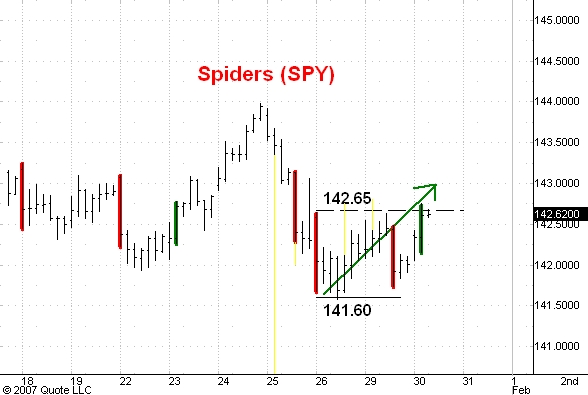
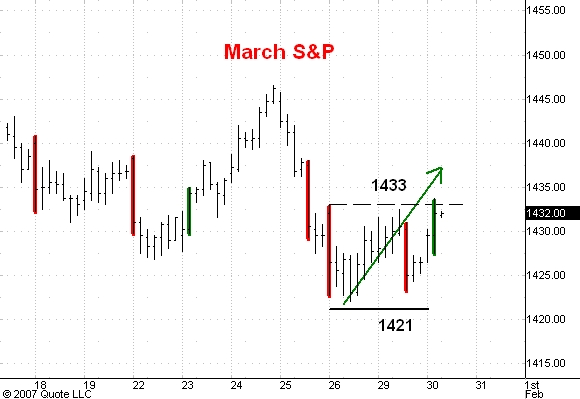
Here are hourly charts of the March S&P futures, the Spiders, and the QQQQ's. I last commented on these markets here.
I think the technical condition of these three markets is becoming more and more bullish. The last three hourly bars that I have highlighted are telling an important story.
The first two of these bars, highlighted in red, are wide range down bars and indicate selling by longer time frame traders. As always, sellers are accomodated by buyers so one must guess the motivations and time frames of the buyers to make deductions about the direction of the market's trend. In this case both bars travelled pretty much the same range and this hints that the same sellers were at work both times. But in neither case was there any follow through selling. This tells me that the buyers were also longer time frame traders.This already hints at bullish potential.
The last highlighted bar on the chart is a wide range up bar occurring near the highs of the last two big down bars. This indicates longer time frame buying. It is doubly significant because it shows longer time frame traders raising their bids and doing so right in the area where longer time frame sellers were active the previous two days.
This is very aggressive bullish activity and I think it means that the markets are about to move above the resistance levels indicated on these charts and climb to new highs for this bull market.
5 comments:
Hi Carl,
love the site... very informative. Is oil still heading back down??? Or is it going through 56???? thanks.
if USO closes above 47? then what is your next target? thanks
re USO AND OIH..USO rallied to fib target of 47.37 and the OIH RALLIED THE ''LAST GASP .886.
i wish to add a thought to my previous...very often when a stock or index goes straight and stops at a key level as the USO did today, and then trades straight across without the slightest hint of a bull flag or an abcd retrace, it has the potential to become what we call a chimney and give the whole move back. recent examples on you charts can be found in AAPL and GE.it is simply a matter of seeing what happens tomorrow.
Carl,
Thanks for what you do. Always a good read and good accuracy. Not to shoot myself in the foot for your freebies but you should think about starting a pay service where you just issue "long" or "short" signals like some of these other services do, i.e. Intelli-Timer or Equi-Trend. You'd be good at it and no doubt a large extra income. Though the above mentioned services may not like you for it.
Chris
Post a Comment