Tuesday, January 31, 2006

Gold and Silver


Here are updated hourly charts showing pit trading in April gold and March silver.

Both these markets have been stronger than I anticipated, but I still think the next big move will be downward. Nonetheless, both close above resistance that I cited in this morning's guesstimate so I have to conclude that there is still more left on the upside.

April gold's key level for me is 573 ( the corresponding level in the February contract was 568) and since the market closed above there I now expect a move to about 600 before any substantial break begins. A close back below 573 tomorrow would switch me back to a short term bearish view.

March silver closed visibly above 979 resistance so I think the market is headed for 1023, just a little above resistance at the 2 7/8 multiple of the 351 low in 1992.

S&P


Here is an updated hourly chart of the March S&P futures.

After this afternoon's Fed announcement of a 25 basis point increase in the funds rate the market dropped to1280 support. I think it is headed back up from here and will soon reach the 1320 level.

Here are some links to.......

My 2006 bond market forecast


The latest update on Lindsay's Three Peaks and a Domed House


My 2006 stock market forecast

Guesstimates on January 31 , 8:50 am ET

March S&P Futures:  Support today is again at 1280 and I think the market is on its way to 1320. The market should reach the 1350 level in a couple of months.  

March Bonds: The bonds will encounter resistance at 113-04 and the next support below the market is at 111-16. I think the market is on its way into the 107-108 zone.

March 10 Year Notes: The notes will meet resistance at 109-00 and now I think the market is headed for 107-26. I think notes will reach 104 or so in a few months.

Cash Eurocurrency: The market is headed down to at least 113.  

March Crude: Crude rallied to 68.65 last night but I still think it is headed down to 64.00 and then to 55.00.

February Gold: I expect gold to close below 568 today and begin a move down to 470. A close above 568 will mean that 595 will be reached soon.

March Silver: I expect silver to close below 979 today and then start a move to 750 or so. A close above 979 will probably mean that the market is headed for 1030.

Google: GOOG should hold support near 420 and the next upside target is 495.

Monday, January 30, 2006

Chicago Merchantile Exchange


Here is a daily chart of the Chicago Merchantile Exchange.

I have been very bullish on this stock since I first commented on it when it was trading around the 300 level. It has now reached my original bull market target at 411 but I think it will still reach the revised target at 440. CME is still leading the market upward so there is a good chance that it will move higher than 440 before its bull market ends.

Baidu


Here is a daily chart of Baidu.com.

Shortly after its IPO I was very bullish on Baidu, figuring that the big upmove in Google would ignite a frenzy in BIDU too. I was dead wrong and you can see the result. BIDU is down about $100 from the high it reached shortly after its IPO although it is still up about $25 from its IPO price of $27.

I still think this dog will have its day but probably not until the next bull market cycle of 2007-2009. In the meantime it looks like the 50-52 are is going to be strong support and a rally into the 75-80 range should be the next development.

US Dollar


Here is an updated hourly chart of the cash US Dollar index.

I think the dollar bull market has resumed and will carry the index to par or above.

In the meantime the first minor resistance on the way up is at the 90.25 level.

Silver


Here is an updated hourly chart showing pit and electronic trading in March silve futures.

I still think the 979-85 zone is strong resistance and I expect a big break to below 8.00 to start soon.

S&P


Here is an updated hourly chart showing pit trading in the March S&P futures.

I think the market made a third consecutive higher low Friday around 1283 and is about to step up to its last top around 1301. We should see the 132o level in a week or two.

Guesstimates on January 30 , 8:50 am ET

March S&P Futures:  Support today is at 1280 and I think the market is on its way to 1320. The market should reach the 1350 level in a couple of months.  

March Bonds: The bonds couldn’t rally as far as 113-12 resistance and now I think they are headed for 111-16.  I think the market is on its way into the 107-108 zone.

March 10 Year Notes: The notes didn’t make it to resistance at 109-00 and now I think the market is headed for 107-26. I think notes will reach 104 or so in a few months.

Cash Eurocurrency: The market is headed down to at least 113.  

March Crude: Crude rallied to 68.42 last night but now I think it is headed down to 64.00 and then to 55.00.

February Gold: A move down to 470 is underway. Resistance today is still at 565.

March Silver: Silver reached the 979 level this morning.  This market has been stronger than I expected but I think the 979-985 zone will mark the start of a move down to 750 or so.

Google: GOOG should hold support near 420 and the next upside target is 495.

Friday, January 27, 2006

Another Top-to-Top Count


Here is a daily chart of the Dow Industrials which shows George Lindsay's top-to-top counts.

I last discussed this subject here and here and I also mentioned it in my Three Peaks and a Domed House update.

I have added another count to the chart. This one has its base point labeled F on January 10, 2006. This was the low of a one day dip prior to the January 11 top. Using Lindsay's rule and counting forward 105 days we find that April 25 is the ideal date for a top in the Dow.

Note that this method also forecasts tops for March 17 and April 5. I think the March 17 prediction will at best correspond to a very minor top because yesterday the 20 day moving average of the daily count of advancing issues on the New York Stock exchange reached a new high for the move up from the October 13 low. This means that an important top is unlikely prior to March 26. This leaves us with April 5 and April 25 as possible dates for the end of the bull market advance.

Remember that Lindsay said every bull market top he had studied was timed by a top-to-top count. Right now I am leaning towards April 5 but given the amount of bearish sentiment still in the market I am starting to give April 25 almost as much probability.

Guesstimates on January 27 , 8:50 am ET

March S&P Futures:  Support today is at 1275 and I think the market is on its way to 1320. The market should reach the 1350 level in a couple of months.  

March Bonds: There is resistance at 113-12 and from there the bonds should drop to 112-00. I think the market is on its way into the 107-108 zone.

March 10 Year Notes: Resistance is at 109-00 and from there the notes will probably drop to 107-30. I think the market is headed down to 104 or so.

Cash Eurocurrency: Resistance is still at 123.00 and I now think the market is headed down to at least 113.  

March Crude: Resistance today is at 67.50 and I think this market is on its way to 55.00.  

February Gold: A move down to 470 is underway. Resistance today is at 565.

March Silver: Silver reached the 979 level this morning.  This market has been stronger than I expected but I think the 979-985 zone will mark the start of a move down to 750 or so.

Google: GOOG should hold support near 420 and the next upside target is 495.

Thursday, January 26, 2006

S&P


Here is an updated hourly chart showing pit trading in the March S&P futures.

The market held 1262 support yesterday and today has established two consecutive higher lows. This is more bullish evidence supporting my view that the market has made its reaction low and is headed up to 1320.

Google


Here is an updated hourly chart of Google.

This morning I thought GOOG would hold yesterday's low aroudn 429 but as you can see the market went as low as 423. I think there is good support around the 420 level and from there the next leg up in the move to 495 should start.

Crude Oil


Here is an hourly chart showing pit and electronic trading in March crude oil futures.

I think this market is on its way to 55.00 and eventually much lower than that. In the meantime I don't think the current rally will go past 67.50 and the next downleg should find temporary support in the $62-63 range.

Gold


Here is an hourly chart showing pit and electronic trading in February gold futures.

I think the market is going down from here. In fact I suspect that we have made the bull market top and if so I would expect a drop to about $350 extending over the next year to 18 months.

In any case I think this market is headed for $470 over the next couple of months.

US Dollar


Here is an hourly chart of the cash US Dollar index.

I think the dollar has resumed its bull market which I expect to take it at least to 100 and eventually much higher than that. My short term target right now is 90.00.

Guesstimates on January 26 , 8:50 am ET

March S&P Futures:  Support at 1262 held late yesterday and the market is now headed up to 1320. Today support comes up a bit to 1267. The market should reach the 1350 level in a couple of months.  

March Bonds: There is minor support today around 112-12 but at best a rally of a point from there to 113-12 will follow. I think the market is on its way into the 107-108 zone.

March 10 Year Notes: There is minor support in the notes today at  108-12 but any rally from there will probably halt near 109-00. I think the market is headed down to 104 or so.

Cash Eurocurrency: Resistance is still at 123.00 and I now think the market is headed down to at least 113.  

March Crude: Resistance is at 68.20 and I think the market is on its way to 62.00 and then to 57.00.

February Gold: A move down to 470 is underway. Resistance today is at 565.

March Silver: Silver has resistance today at 958.  I still think that the next big development will be a move down to 760.

Google: GOOG bounced off of resistance at 456 yesterday but held its first hour low even as the S&P made new lows for the day. This makes me think that yesterday’s 429 low will hold and that GOOG will now resume its advance to the next target at 495.  

Wednesday, January 25, 2006

T-bonds


Here is an hourly chart showing pit trading in the March T-bond futures.

I think a big move down has started. It will probably carry the bonds to 107-108. I see minor support at 112-12 but I only think it can generate a rally of about a point.

S&P


Here is an hourly chart showing pit trading in the March S&P futures.

A little while ago the market dropped to 1262.50, just a shade above 1262 support. A close today above 1268 would convince me that the low is in. Otherwise we will probably see the 1259 level tomorrow before a rally to 1320 starts.

The second chart above this post shows the daily count (in black) of the number of New York Stock Exchange issues which advance in price and the five day moving average of this number (in purple).

Notice that both these lines are above the low levels reached last week while the S&P itself has dropped below last week's low. This positive divergence is another reason to think a big rally is about to begin.

Guesstimates on January 25 , 8:50 am ET

March S&P Futures:  Support is at 1262 while resistance is at 1275. I am still looking for a low today in the 1262-65 range and expect the market to start a move to 1320 from there. But strength above 1275 will tell me that this up move has already started. The market should reach the 1350 level in a couple of months.  

March Bonds: Resistance today is 114-22 and minor support is at 113-20. I think the market is on its way into the 107-108 zone.

March 10 Year Notes: Resistance in the notes is still at109-20 while minor support today is at  108-20. I think the market is headed down to 104 or so.

Cash Eurocurrency: Resistance is at 123.00 and from there a move to below 115 will begin.  

March Crude: Resistance is at 68.20 and I think the market is on its way to 62.00 and then to 57.00.

February Gold: A move down to 470 is underway. Resistance today is at 565.

March Silver: Siler made a new high this morning and I think resistance today will be found at 955. I still think that the next big development will be a move down to 760.

Google: I think GOOG will bounce off of resistance at 456 and drop to 408 or so before starting a move to the next upside target at 495.  

Tuesday, January 24, 2006

S&P


Here is an updated hourly chart showing pit trading in the March S&P futures.

I still think the market will drop to 1262 or so before starting a move to 1320. However, a close visibly above 1275 resistance today would convince me that the move has already started.

Google


Here is an updated hourly chart of Google.

Yesterday I said that Google would meet resistance at 425 then drop to 405 or so. Contrary to my expectation GOOG today has rallied as far as 444. I think it will continue up to 456 or so but still will pay another visit to its recent low point. My best guess now is that the break from 456 will stop around 408.

Short term fluctuations aside, I still think GOOG will reach 495 in a few weeks.

Gold and Silver


Here are updated hourly charts showing pit and electronic trading in February gold and March silver futures.

I am bearish on both markets. I think there is resistance in gold around 565 and in silver at 932. Gold should drop to 470 or so and silver to 760 over the next couple of months.

Guesstimates on January 24 , 8:45 am ET

March S&P Futures:  I am still looking for a low today in the 1262-65 range and expect the market to start a move to 1320 from there. The market should reach the 1350 level in a couple of months.  

March Bonds: Resistance today is 114-28 and minor support is at 113-24. I think the market is on its way into the 107-108 zone.

March 10 Year Notes: Resistance in the notes is still at109-28 while minor support today is at  108-24. I think the market is headed down to 104 or so.

Cash Eurocurrency: Resistance is at 123.00 and from there a move to below 115 will begin.  

March Crude: Resistance is at 69.40 and from there the market will head down to 62.00 and then to 57.00.

February Gold: A move down to 470 is underway. Resistance today is at 563.

March Silver: A move down to 750 is underway. Resistance today is at 904.

Google: I think GOOG will react to 405 and then star a move to 495.

Monday, January 23, 2006

Eurocurrency


Here is an updated hourly chart showing cash market trading in the Euro- US dollar.

I think there is strong resistance at 123.00 and that the market will soon begin a drop to below 115.

Google


Here is an updated hourly chart of Google.

I think Friday's low at 395 will hold and that GOOG will drop to 405 before resuming its move up to the next target at 495.

S&P


Here is an updated hourly chart showing pit trading in the March S&P futures.

I think we will see a low around 1262 late today or early tomorrow. From there a move to 1320 should begin.

Guesstimates on January 23 , 8:50 am ET

March S&P Futures:  I am looking for a low today in the 1262-65 range and expect the market to start a move to 1320 from there. The market should reach the 1350 level in a couple of months.  

March Bonds: Resistance today is 114-28 and minor support is at 113-30. I think the market is on its way into the 107-108 zone.

March 10 Year Notes: Resistance in the notes is still at109-28 while minor support today is at  108-28. I think the market is headed down to 104 or so.

Cash Eurocurrency: Resistance is at 123.00 and from there a move to below 115 will begin.  

March Crude: Resistance is at 69.40 and from there the market will head down to 62.00 and then to 57.00.

February Gold: A move down to 470 is underway. Resistance today is at 563.

March Silver: A move down to 750 is underway. Resistance today is at 904.

Google: I think GOOG will make a low around 395 and then start a move to 495.

Sunday, January 22, 2006


Monthly chart of 3 month t-bill yields

Monthly chart of 10 year note yields

2006 Bond Market Forecast

Here is my best estimate for the course of short and long term interest rates over the next year. It is based on techniques inspired by George Lindsay's stock market techniques. This year's forecast is really just a modification of what I said last year about 2006, so you should take a look at my 2005 Bond Market Forecast for a more detailed explanation of my approach.

Here are the last three paragraphs of my 2005 bond market forecast:

"Putting these observations together we make the following deductions. First the drop in yields from the May 2004 highs is not yet complete and will probably continue until August 2005. This date is 18 months after May 2004 and is as close as we can get to the yield lows predicted by the 10 year pattern (January and April 2006) without violating the range of historical experience for the 14 year period.

"From the predicted yield low in August 2005 yields will move up for about 15 months (the average duration during the declining phase of the 60 year cycle) until November 2006. We prefer this to the March 2007 date given by the 10 year pattern because the high in short rates (predicted for January 2007) typically follows the high in 10 year yields during the falling part of the 60 year cycle.

"How low will the 10 year yield be at the projected August 2005 yield low? We do NOT expect the notes to drop in 2005 below the 3.07% low yield reached in June 2003. Instead we think the 10 year notes will drop to about 3.60% by August 2005 and then rally to 5.20% by November 2006.From projected yield highs in late 2006 or early 2007 all the interest rate markets should move towards lower yields for about two or three years. That drop in yields should carry the 10 year notes below 3.00% and end the declining phase of the 60 year interest rate cycle that started in 1981."

The actual low yield in the 10 year note during 2005 occurred on June 3 at 3.80%, a couple of months earlier and 20 basis points higher than predicted. The treasury markets are now all in a trend towards higher rates.

I still think the 10 year note yield will make it up to the 5.20% level as indicated on the monthly chart above this post. However, since upmoves in yield typically last an average of 13 months, I would guess that the yield high will probably occur a little earlier than I predicted in my 2005 forecast, say August-September of 2006 as opposed to the November top I predicted in last year's forecast.

I think the top in the 3-month Treasury bill yield will be at the 4.95% level, a tad higher than I predicted last year, and will occur sometime during the last quarter of 2006.

Finally, I want to note that the 10 year cycle suggests we attend to market action during 1996 and 1986 for clues about this year's trend. Both years saw important low points in yield: January of 1996 and April of 1986. Given the current bullishness on the part of bond traders (which I noted here) I conclude that these two precedents are telling us to prepare for a big break in prices and a rally in yields during the first half of 2006.

Saturday, January 21, 2006


Completion of Lindsay's Domed House

Lindsay's Domed House in the S&P


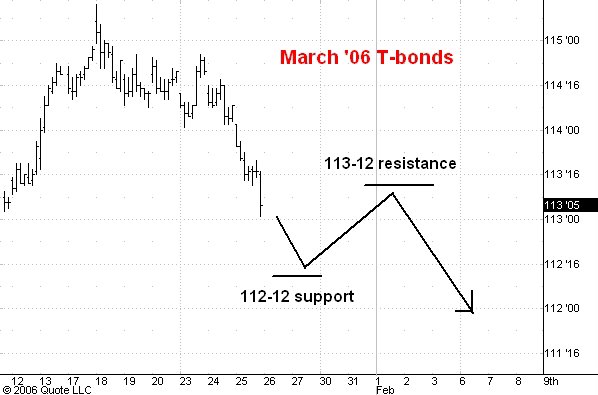
I have discussed George Lindsay's Three Peaks and a Domed House formation many times on this blog. Here is a 
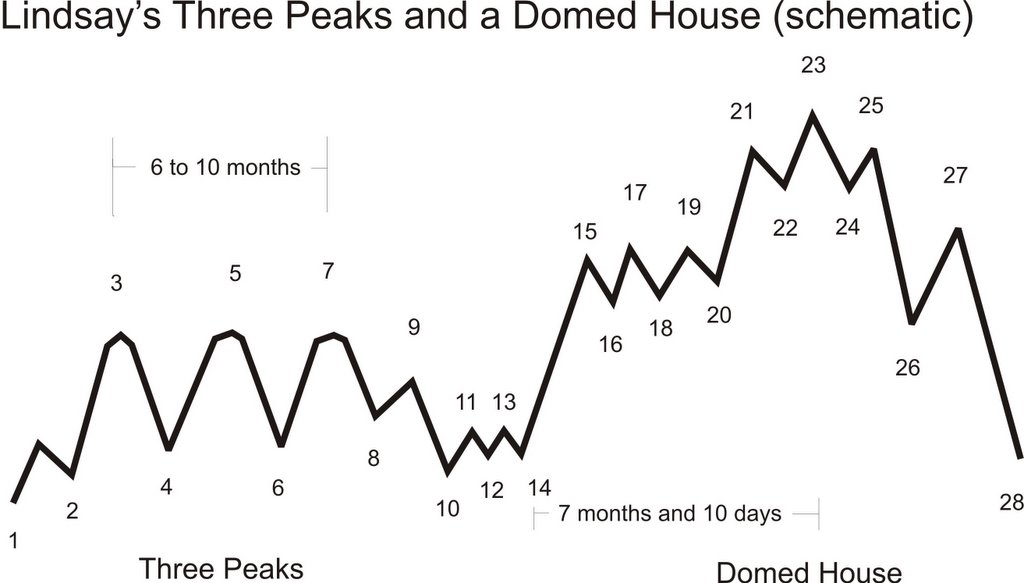
link to all of my George Lindsay posts. The first chart you see above this post is the schematic which describes the ideal Three Peaks and a Domed House formation.

As I last discussed here I think that a three peaks and a domed house formation began in the Dow industrials with point 3 corresponding to the January 2005 top. A similar formation began in the cash S&P with point 3 corresponding to the March 2005 top.

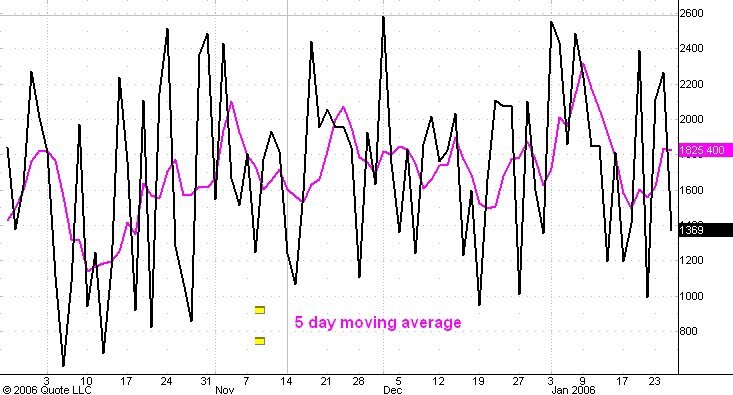
Both averages established point 10 at the October 13, 2005 low and point 14 at the October 27, 2005 low. The 
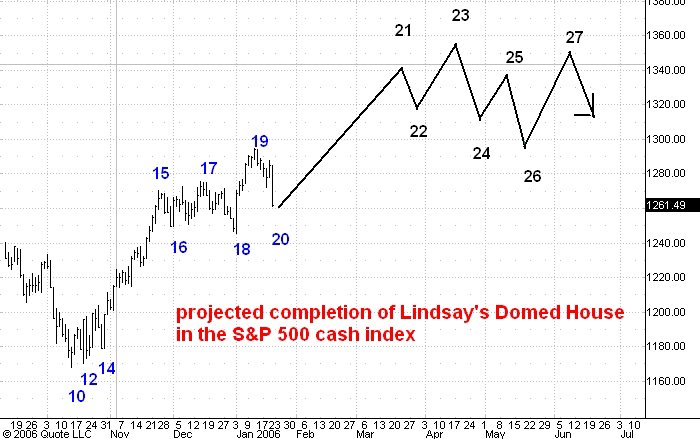
second chart above this post shows what I think is the present postion of the S&P 500 and the Dow in the developing Domed House.

As you can see I think that the upcoming low of the current break will be point 20 and that the next rally will end in points 21-23-25, the dome of the Domed House. I expect this top to develop roughly at the 1350 level in the S&P and probably around 11400 in the Dow.

George Lindsay fans will note that I am expecting point 25 around April 5, the date of the ideal top-to-top count . On the other hand, as you can see in the schematic chart above, the standard time projection from point 14 of 7 months and 10 days calls for point 25 on roughly June 5. Why do I project point 25 earlier than this standard projection?

Lindsay often said that in making a forecast one must try to make all the pieces of the puzzle fit without distorting any one piece too much. In this instance we have four puzzle pieces that must fit together: the Three Peaks and a Domed House projection, the projection based on the technique of Basic Advances and Declines, the projection based on Long Time Periods, and the top-to-top count.

The long time period of 15 years 3 months from the October 1990 low called for a bull market top in early January 2006. So when making a bull market top projection I want to try to get as close to January 2006 as possible without violating the rules for projecting tops given by the other methods.

Right now I think that an extended basic advance started in the S&P 500 on March 12, 2003 and ended on November 23, 2005, an interval of 997 days. Now Lindsay's rule is that after an extended basic advance the market typically goes sideways for a period of months before beginning a basic decline. As I explained in my 2006 stock market forecast I expect this sideways period to last less than 5 months in order to fit with other Lindsay projections and thus the next basic decline should begin no later than April 23. So on this basis our time window for the bull market top now extends from January through April.

Next let's consider the time projection for the Three Peaks and Domed House formation. Lindsay said that this time count generally starts from point 14, but that when other methods point to an earlier top on can count from point 10 or point 6 or even point 4. In this instance I note that point 6 occurred in the S&P 500 on August 29, 2005. Adding 7 months and 10 days brings us to April 7, 2006. As I mentioned above, April 5 is the ideal date for a top according to the top-to-top count. Lindsay said that every bull market top he had studied coincided with some to-to-top count.

So, putting everthing together, I think an April 5 date for point 25 is a reasonable guess. I think point 27 will be timed by the 7 months, 10 day interval from point 14.

I would note also that this projection is consistent with the recent behavior of the 20 day moving average of the daily NYSE advancing issues count which I discussed here. This past Thursday this moving average reached the highest level since the October 13, 2005 low. Based on historical averages, this means that no important top is likely for at least 2 more months, i.e. until after March 19, 2006.

Friday, January 20, 2006

Google Update


Here is an updated daily chart of Google.

Earlier today I said that GOOG would stop in the 415-420 zone but as you can see the market blasted right through there.

My next estimate is for a low in the 390-95 zone. I still think we will see 495 sometime during the next 2 or 3 months.

Crude Oil


Here is an updated hourly chart of March crude oil futures.

I had expected the market to rally from 55 to 64 but the extra 5 dollars on top of 64 has been a surprise to me. Still, I think that crude is heading much lower and will not go above the Katrina top at 70.90. My best estimate of resistance after the 66.90 level is 69.50.

Google


Here is a daily chart of Google.

This morning I estimated support at 420 and at the moment GOOG is trading a tad below that level. I would guess that the market will continue down a bit further to 415 or so and then start a move up to 495.

S&P


Here is an hourly chart of pit and electronic trading in the March S&P futures.

I was anticipating a higher low at 1282 support today but as you can see the market blew right through that level. Right now I would estimate that we will see a low around 1265 from which point the market should advance to 1320.

Guesstimates on January 20 , 8:50 am ET

March S&P Futures:  The market is on its way to 1320.  Support today is at 1282. The market should reach the 1350 level in a couple of months.  

March Bonds: Resistance today is 114-28 and minor support is at 113-30. I think the market is on its way into the 107-108 zone.

March 10 Year Notes: Resistance in the notes is still at109-28 while minor support today is at  108-28. I think the market is headed down to 104 or so.

Cash Eurocurrency: The market is now headed below 115. Resistance today is at121.30.

March Crude: The market will now head down to 62.00 and then to 57.00.

February Gold: A move down to 470 is underway. Resistance today is at 563.

March Silver: A move down to 750 is underway. Resistance today is at 920.

Google: Closed below support at 439 so I think GOOG is headed for 420 before turning up again. Next upside target is still 495.  

Thursday, January 19, 2006

Nasdaq Composite


Here is a weekly chart of the Nasdaq Composite index.

The bear market low was 1108 in October 2002. I have drawn three important resistance levels on the chart. The black line sits at the 2566 level which is 1/2 the all time high for the index at 5133 in March of 2000. The blue lines are the 2 and 1/8 and the 2 and 5/8 multiples of the 2002 low at 1108. I think the bull market will end at the 2 and 5/8 multiple which is 2908.

Gold


Here is an updated hourly chart showing pit and electronic trading in February gold futures.

I see resistance above the market at 557 and from there I am expecting a drop to 515 or so. The latter level is the bottom of the second 25 dollar box down from the 565 top.

Silver


Here is an updated hourly chart showing pit and electronic trading in March silver futures.

As you know I think this market is now on its way to 750. Today I see resistance at 907 and from there I expect the market to drop to 825. The latter level is the bottom of the second 56 cent box down from 935. The first box was defined by the intial break from 935 to 879.

Guesstimates on January 19 , 8:50 am ET

March S&P Futures:  The market is on its way to 1320.  Support today is at 1282. The market should reach the 1350 level in a couple of months.  

March Bonds: Resistance today is 114-28 and minor support is at 113-30. I think the market is on its way into the 107-108 zone.

March 10 Year Notes: Resistance in the notes is still at109-28 while minor support today is at  108-28. I think the market is headed down to 104 or so.

Cash Eurocurrency: The market is now headed below 115. Resistance today is at121.30.

March Crude: The market will now head down to 62.00 and then to 57.00.

February Gold: A move down to 470 is underway.

March Silver: A move down to 750 is underway.

Google: Support today is 439 but the next move up will carry to 495.  

My 2006 Stock Market Forecast

can be found here.

Wednesday, January 18, 2006

S&P Update


Here is an hourly chart showing pit and electronic trading in the March S&P futures.

With about 45 minutes left in the trading day it looks to me like the market has held support at 1279 and is about to start its rally to 1320.

A small piece of supporting evidence can be found in the daily count of the number of issues on the New York Stock Exchange which advance in price each day. This is the black line in the second chart above this post.

Notice that today's advancing issues count is visibly above yesterday's even though the S&P today made a lower low than yesterday's. This is a minor bullish divergence and is telling us that the reaction from the 1301 level is probably over.

US Dollar


Here is an updated hourly chart of the cash US Dollar index.

I had expected the market to drop to 88.20 before resuming its bull market but I have changed my mind about this. I now think that the reaction low occurred at 88.73 and that the market is now headed up to 91.40 and evenutually above the 93.00 level.

Eurocurrency


Here is an hourly chart of the cash euro/dollar. I thought that this market would make it up into the 121.80 to 122.20 zone but I have decided to give up the ghost on this one. I now expect the market to move down to below 115.

Bond Market Sentiment


This morning the bond and note futures reached new highs for the rally which began from the November 4, 2005 low.

As you know I am bearish on both markets. I think the bonds are headed for 108 and the notes for 105. Above this post you will see two charts which support my contention that interest rates will be heading higher and bond prices lower from here.

These charts are available to subscribers of Decisionpoint.com. I think the $20 per month subscription price is well worth it for anyone interested in the technical analysis of the markets.

The first chart shows the yield on the 30 year treasury bond (actually a 26 year bond now). Remember that when bond prices go up interest rates go down and vice versa. So the rally in bond prices over the past 2 and 1/2 months shows up as a drop in yields on this chart.

The second chart shows the Rydex bond ratio (blue line) and its 20 day exponential moving average (red line). The Rydex bond ratio records the level of assets held in one of the Rydex family of funds which bets on falling bond prices (rising interest rates) to the level of assets held in another Rydex fund which bets on rising bond prices. So low levels of the bond ratio reflects a general expectation that bond prices will rise while a high levels shows that traders expect bond prices to fall.

As you can see on the chart the Rydex bond ratio has recently dropped to its lowest level of the past two years. The 20 day exponential moving average is near a similar extreme.

This means that bond traders currently expect interest rates to fall and bond prices to rise from current levels. I think they will be disappointed. This is a situation in which it makes sense to "fade" the crowd.

S&P


Here is an updated hourly chart of the March S&P futures showing pit and electronic trading.

You can see that early this morning the market dipped a bit below 1276 and since then has rallied sharply. I think this means that a move to 1320 has begun and that this morning's low will hold. It is still likely that the market will react back to 1279 support once more before before the upmove begins in earnest.

Google


Here is an updated daily chart of Google showing today's price action so far.

GOOG hit support at 450 this morning and is now headed higher. Next upside target is 495.

Guesstimates on January 18 , 8:50 am ET

March S&P Futures: The market has reached support at 1279. I still see no sign that the drop from 1301 has ended so another 10 points down to 1269 is still a 50-50 bet. In any case the next significant development will be a rally to 1320. The market should reach the 1350 level in a couple of months.

March Bonds: The bonds made new rally highs at 115-13 on the CPI news this morning but I think the market is about to turn lower and drop into the 107-108 zone. In fact I suspect that 115-13 was the high tick.

March 10 Year Notes: The notes made a new rally high at 110-06 this morning but I think the market is about to turn lower and head down to 105 or so.

Cash Eurocurrency: The market should rally into the 121.80 to 122.20 zone. That should end the move up from 116.39.

March Crude: There is a very high probability that this morning’s high of 67.50 marked the end of the rally from 57.00 and that the market will now head down to 62.00 and then to 57.00.

February Gold: A move down to 470 is underway.

March Silver: A move down to 750 is underway.

Google: Support is at 450 and I see no sign that the bull market in GOOG is over. Next upside target is 495.

Tuesday, January 17, 2006

Crude Oil


Here is an hourly chart showing pit and electronic trading in March crude oil.

I didn't think the market would make it above 65.00 but it did and now I estimate that today's high at 66.90 will halt the rally. The next move will be downward to 62.00 and then to the low of the current trading range in the March contract at 57.00.

Gold and Silver


Here is an hourly chart showing pit and electronic trading in February gold futures.

I had expected the market to make it up to 568 but it only made it to 565.50 last night before it started to drop. Today it made a lower top at 561 and closed weak. This means that gold has started a dropt to 470.

Silver has behaved similary, making it up to 935 (vs. my 940 expectation). It is now headed for 760.

Guesstimates on January 17 , 8:50 am ET

March S&P Futures: The market has reached support at 1287 but a lower top made yesterday makes it likely that a move to lower support at 1279 is underway. From there it will rally to the next upside target at 1320 where it is likely to stall for a few days and react 20 points or so. The market should reach the 1350 level in a couple of months.

March Bonds: I now believe that the December 30 top at 115-00 will hold and that the market is on its way to the 107-108 zone. Resistance above the market stands at 114-12.

March 10 Year Notes: It now looks like the 110-05 top on January 6 will hold and that the market is headed down to 105 or so. Resistance above the market is at 109-20.

Cash Eurocurrency: Support today is 120.00 and from there the market should rally into the 121.80 to 122.20 zone. That should end the move up from 116.39.

March Crude: The 65-66 zone is strong resistance and I think from there the market is headed for 56.50. I expect crude to trade in a range of $55 to $65 for several months before going much lower.

February Gold: Resistance is at 568 and the next big move will be downward to 470.

March Silver: Resistance is at 940 and the next big move will be downward to 750.

Google: GOOG has reached its short term upside target at 470. Support is at 450 and I see no sign that the bull market in GOOG is over. Next upside target is 495.

Monday, January 16, 2006

Gold and Silver


Here are hourly charts of February gold futures and March silver futures. The US markets are closed today so the charts only show pit and electronic trading through Friday's close.

Contrary to my expectation gold made a new contract high Friday. I think it will continue upward to 568 and then drop to the 470 level which is 1 and 7/8 times the 1999 low at 252.

Silver has stayed below is December high of 934 and is thus highlighting a likely rollover in the metals complex. I expect silver to take a brief peek above 934 and reach 940. Then I expect the market to drop to 750 which is 2 and 1/8 times the 1992 low at 351.

Looking further ahead I think gold and silver are making bull market tops here and that both markets will soon begin a decline lasting 1 to 2 years which will carry gold to 350 and silver to 500.

Friday, January 13, 2006

Guesstimates on January 13 , 8:50 am ET

March S&P Futures:  The market is stalling at short term resistance at 1298 but should hold support around 1287. From there it will rally to the next upside target at 1320 where it is likely to stall for a few days and react 20 points or so. The market should reach the 1350 level in a couple of months.  

March Bonds: I now believe that the December 30 top at 115-00 will hold and that the market is on its way to the 107-108 zone. Resistance above the market stands at 114-12.

March 10 Year Notes: It now looks like the 110-05 top on January 6 will hold and that the market is headed down to 105 or so. Resistance above the market is at 109-20.

March Eurocurrency: Support today is 121.00 and from there the market should rally into the 122.80 to 123.00 zone. That should end the move up from 116.61.

February Crude: The 64-65 zone is strong resistance and I think from there the market is headed for 56.50. I expect crude to trade in a range of $54 to $64 for several months before going much lower.

February Gold: I now think that gold has made a lower top and is on its way down to below 490.  

March Silver: I now think silver has made a lower top and is on its way to below 800.  

Google: GOOG has reached its short term upside target at 470. Support is at 450 and I see no sign that the bull market in GOOG is over. Next upside target is 495.

Thursday, January 12, 2006

Guesstimates on January 12 , 8:50 am ET

March S&P Futures:  The market is stalling at short term resistance at 1298 but should hold support around 1285. From there it will rally to the next upside target at 1310 where it is likely to stall for a few days and react 20 points or so. The market should reach the 1350 level in a couple of months.  

March Bonds: I now believe that the December 30 top at 115-00 will hold and that the market is on its way to the 107-108 zone. Resistance above the market stands at 114-12.

March 10 Year Notes: It now looks like the 110-05 top on January 6 will hold and that the market is headed down to 105 or so. Resistance above the market is at 109-20.

March Eurocurrency: Support today is again at 121.00 and from there the market should rally into the 122.80 to 123.00 zone. That should end the move up from 116.61.

February Crude: The 64-65 zone is strong resistance and I think from there the market is headed for 56.50. I expect crude to trade in a range of $54 to $64 for several months before going much lower.

February Gold: Short term support is at 540 and gold should hit 560 before a big break begins.  

March Silver: Today support is again 894 and silver will probably rally back to 930 before a big break begins.

Google: GOOG has reached its short term upside target at 470. Support is at 450 and I see no sign that the bull market in GOOG is over. Next upside target is 495.

Wednesday, January 11, 2006

Bond Market


This morning I thought that the bond market was in good shape and would stage a final rally which would end the up move from the November 4 low.

Today the March T-bond futures closed below support at 113-12. Since I think we are in a bear market I have to conclude that the 115-00 high on December 30 was the top of the rally from the 110-12 low of November 4 (in the December '05 contract).

I think this market is now headed below 108. The hourly chart above this post shows what I think is the likely path of short term fluctuations. There should be temporary support near 112-24 but the rally from there is not likely to carry past 114-00.

IBM


Here is a daily chart of IBM.

IBM dropped about 4 points more from its 90 high than I had originally expected but I think it has turned upward once more. The next upside target is 95. Several months ago I predicted that IBM would reach the 106-108 zone early this year. I still think this can happen.

Microsoft


Here is a daily chart of Microsoft.

I think MSFT is about to break out of its 5 year trading range between 20 and 30 and the move will carry at least to the 42 level which is 2 and 1/8 times the 2000 low at 20.12. Over the short run MSFT has held support at 26.20 and is now headed for 30.20.