
Here are hourly charts of the March S&P futures, the Spiders, and the QQQQ's. I last commented on these markets here.
I had expected yesterday's low points to hold, but this morning all these markets broke those lows decisively on a wide range down bar. In fact the Q's made a new low for the reaction that started from their January 16 top.
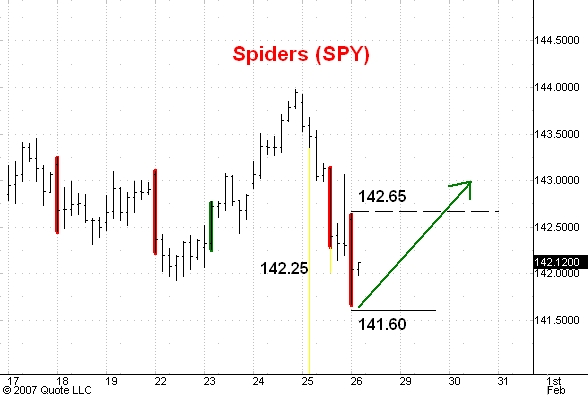
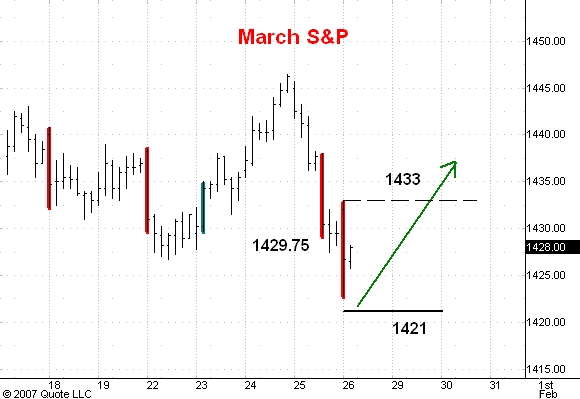
I am still willing to bet that this morning's low points pretty much ended the break from yesterday's highs. The support levels I am working with are shown on the charts.
Today's first hour high is also drawn on the chart. As the high of a wide range, down bar this is normally pretty strong resistance for any rally. If I am reading this market correctly then the market will rally above this resistance level on Monday.
6 comments:
This is going to be a tall-order to fulfill.
Carl, have you ever read the work of J.M. Hurst?
Hurst analysis is one of the best out there and is calling for more rally after a 2.5 week low due today/monday
What do you deluded bulls (who think we are somehow back in 1999 where everything goes up and up in a straight line just because that moronic network called CNBC says so) think about the fact that the S&P 500 just completed a key day reversal (yesterday), and is *very close* to completing a weekly reversal today, with a futures close below 1431. Even if it doesn't complete that weekly reversal, the market is showing huge signs of exhaustion and negative divergence. To put it simply for you -- retail stupid money is buying, smart sophisticated money is selling. Wake up and smell the roses.
You are so wrong why even try. The charts on the s&p look like those on Cell almost the exact pattern. what happened there is scary. I have seen many charts forcasting recession. And you lead those in the weakest month of the year to start buying for some dilusional rally. I agree with other posters here wake up and smell the coffee. My personal broker said you domed house people are a joke!You have been off on gold that is going higher you were off last year on your bottoms and rallies and now here you are again off!
i see things a little different.the primary message from mr fitia's work is that the market is building an important top and that the easy money on the long side has been made.i believe with the current multiplier, a two point pop in each dow stock and the dow would be at his target. the upside targets he has for the individual stocks he shows could lead one to think he is a deluded bull.but i think he is just pointing to what always happens... as the market makes a top, the momentum traders concentrate their energies in fewer and fewer stocks and push them to extremes. his work simply shows based on his tools what those extremes are.my short term work does not agree with mr futia's but i think i can reconcile it with his bigger picture lindsay work. my work suggests that the marginal new highs made this week were point 19 and that point 20 still lies ahead. if that proves to be the case, then point 23 would shift in time and square with his important basic advance date of may17..as a practical matter, i have price levels that will tell me if my analysis is correct by trading to these levels ( wthin 10 cents) and then turning down.iwm 78.62,spy 142.60,qqqq44.18, dia 125.12.
when i read what i had posted i saw that i had not said what my work was telling me.my work is based on having no opinion and each day drawing a bullish and bearish chart for each index i trade. the numbers i posted are where i expect the bears to make a stand and that if they held and price turned lower,the bears would be in control..
but i think, strictly based on my charts , that something very important happened at fridays lows that speak directly to mr futia's short term indecision the past few weeks.since late november the charts of the five indexes i trade(qqqq,dia,iwm,spy, mdy) have been out of sych. for the first time since late november the iwm,spy and mdy bottomed simultaneously in a way that is very important based on my simple tools with the dia and qqqq getting close but not exact...the ideal scenario on monday would be for the dia and qqqq to make marginal new lows( perhaps on some earnings driven news) while the spy, iwm, and mdy hold fridays lows... at that point all the indexes would be aligned to move higher.
Post a Comment