Real Time e-mini S&P Trading, plus contrarian commentary on all the markets, all the time
Friday, March 31, 2006
S&P
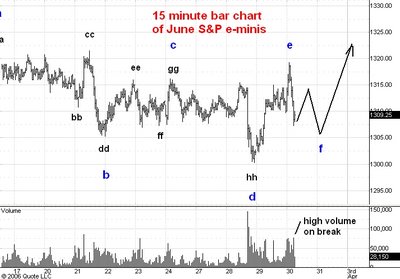
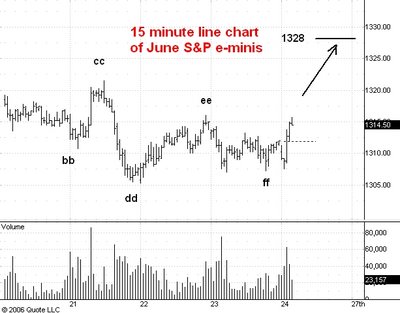
Here is a 15 minute chart of the June S&P e-mini futures. I commented on this chart yesterday afternoon.
I had believed that yesterday's low at 1304.75 would hold but today we completed a three phase rally to 1311.75 and then dropped to 1302.75. Once again the move down from blue point d has three distinct phases and the first two phases themselves were three phase moves. I think the market has ended its drop from yesterday's high at 1319 and is now about to rally to 1328.
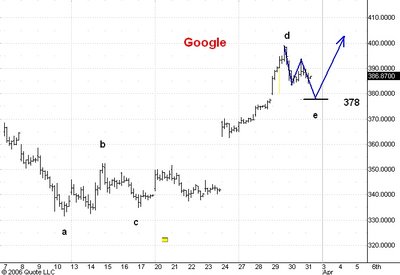
Here is an hourly chart of Google.
I expect the reaction from point d to assume a standard three phase shape. We have already completed the first two phases and I think the market will drop to 378 or so while completing the third phase of the drop. That would make the swing down to point e just a tad longer than the drop from b to c.
Once the d-e swing is completed I expect a rally into the 410-15 zone as the next development within a move to 440.
Nasdaq Composite
Here is a weekly bar chart of the Nasdaq Composite index. I last commented on this chart here.
This average made new bull market highs this week. The striking thing about this chart is the clearly defined sequence of higher lows, each of which terminates a reaction that was smaller than the preceeding reaction. This is a sign of a market that is gaining technical strength, not loosing it as so many market technicians seem to believe.
I think the Nasdaq compostite will easily reach my 2550 bull market target. The risk I see is that the market is much stronger than even I believe. If so the rally will carry further to the 2900 level.
Guesstimates on March 31 , 8:50 am ET
June Bonds: The market is headed for its next short term target at 108-16. Resistance is at 109-14.
June 10 Year Notes: The notes are headed down to 105-16. Resistance is at 106-20.
US Dollar -Euro: The market is now headed down to 118.90. After that a move to 125.00 becomes likely.
May Crude: 66.95 is resistance and the next significant move will be downward to 56.80-57.20. I think that over the next few months the market will drop to 52.00 or lower.
April Gold: I think gold has a good shot at 600. Meantime 579 is support.
May Silver: Silver traded at1194 this morning and is now getting close to support at 1140. Upside target is 1205 after which I anticipate a big drop.
Google: I am convinced that GOOG is on its way to 405 and then to 440 although a move to 495 no longer seems likely. Support is at 377.
Thursday, March 30, 2006
Gold
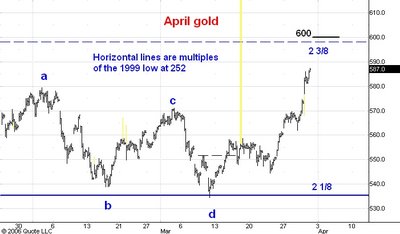
Here is an hourly chart showing pit trading in April gold futures. Next week I am going to switch to the June contract which is currently trading about $5 over April. Keep this in mind when you read the rest of this post.
Gold has been underperforming silver lately and on this basis I concluded that the move up from point d on the chart would be a three phase correction ending below the bull market high at 579. But today the market gapped above that high and instead of finishing the day weak rallied sharply into the close. This convinces me that it is heading for resistance at the 598 level which is the 2 3/8 multiple of the 1999 low at 252. I think the market will take a quick peek above 600, a nice round number but that should be it. The next $ 100 from there should be downward.
S&P Update
Here is a 15 minute chart of regular hours trading in the June S&P e-mini futures.
I commented on this chart earlier this morning. Since then the drop from this morning's high has assumed a clear, three phase shape and the market has dropped as low as 1304.75, vs. my estimate of 1304. Moroever, there is a small volume climax visible at the extreme bar of the break and the volume there was visibly less than the high volume bar that ended the first phase of the correction. This shows that the bearish pressure on the market has decreased.
At this juncture I think that the three phases of the correction from this morning's high are complete and that market is about to resume its uptrend to 1328.
Silver
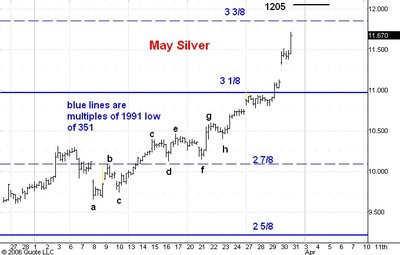
Here is an hourly chart of pit trading in May silver futures. Above that chart you will also see a monthly chart of silver futures trading going back to 1989.
I had been expecting a long term top in silver near the 1/2 point (950) of the second box up from the 351 low in 1999. But the market has proven much stronger than I was expecting. Today it actually has moved a bit above the top of the second long term box (at 1150) and traded as high as 1171.
I think the top of the second box at 1150 is going to be strong long term resistance and that the next big move will carry the market down to the 1/2 point of the box (950) or even to the bottom of the box (750). Meantime there is resistance above the market at the 3 3/8 multiple of the 351 low at 1185. Since the market has yet to start producing shorter swings within the move up from 915 I think it will probably hit 1205 before any break begins.
S&P
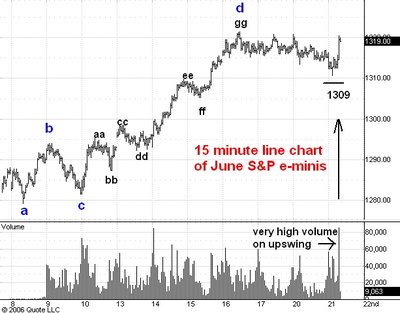
Here is a 15 minute bar chart of the June S&P e-mini futures.
A little before the pit opening this morning the market dropped to 1309 support and after the opening rallied to 1319, just a shade under the 1321.50 bull market high.
The subsequent break occurred on high volume and broke a little below 1309 support. The high volume means that we haven't seen the low of the drop from this morning's high yet, especially since it started from the high of a long trading range. Such moves typically go back to near the low of the trading range before they end.
So I now expect the drop from this morning's high to assume a typical three phase structure, with the second phase rally carrying the market up to 1312 or so. I am looking for the third phase to end near 1304. Once it is complete the next swing should carry the market to 1328.
Guesstimates on March 30 , 8:50 am ET
June Bonds: The market is headed for its next short term target at 108-16.
June 10 Year Notes: The notes are headed down to 105-16.
US Dollar -Euro: The rally from yesterday’s low at 119.78 now looks like the third phase of the move up from 119.51 and as such should reach the 121.20 level. Then the market should turn downward to 118.90. After that a move to 125.00 becomes likely.
May Crude: 66.95 is resistance and the next significant move will be downward to 56.80-57.20. I think that over the next few months the market will drop to 52.00 or lower.
April Gold: The market traded about $6 above my 574 target overnight and reached a new bull market high by a dollar or so. Nonetheless I think the next big move will be downward from here and resistance today will be at 583.
May Silver: Silver traded at1152 this morning, way above my 1108 target. Even so I think the market will close below 1140 today and begin a sustained drop.
Google: I am convinced that GOOG is on its way to 405 and then to 440 although a move to 495 no longer seems likely. Support is at 377.
Wednesday, March 29, 2006
Silver
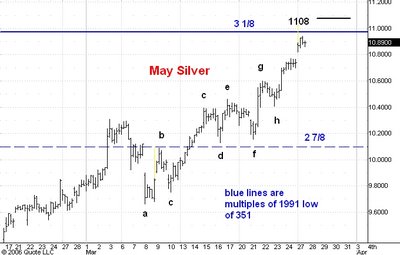
Here is an hourly chart of pit trading in May silver futures.
The market has reached my revised target at 1108 and I think it is about to begin a break to 920 or so.
Gold
Here is an hourly chart of pit trading in April gold.
The market has reached the 574 resistance level and I think it is about to turn downward from here and drop below 500.
S&P Details
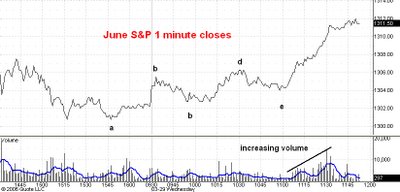
Here is a line chart showing prices at one minute intervals during regular hours trading in the June S&P e-mini futures.
I have labeled the swings since yesterday's low at 1300.25. The important thing to notice is that the current swing upward from point e is the longest of the upswings in both price and time. Moreover, volume has steadily increased on this upswing. As I observed in my previous post the entire move up from point a has already exceeded the length of the biggest rally in the correction from 1321.50 to 1300.25.
All these facts are signs of a strong market and are telling me that the move up from point a has a lot further to go.
S&P
Here is a 15 minute chart of regular hours trading in the June S&P e-mini futures.
I was expecting a dip below 1300 towards support at 1297 but this didn't materialize. The market dropped as low as 1300.25 yesterday and as you can see has rallied strongly today.
What catches my attention in this chart is that the rally from yesterday's low has continued on relatively high volume compared to the volume on the uplegs from dd to ee and from ff to gg. Moreover, just a short while ago the entire rally from blue point d has exceeded the length of the rally from blue b to blue c. Since the entire reaction from the 1321.50 level, blue a-b-c-d, has a clear three phase structure I conclude that we have seen the reaction low at 1300.25.
Now the market should head up to 1328 and eventually to 1350 by late April or early June.
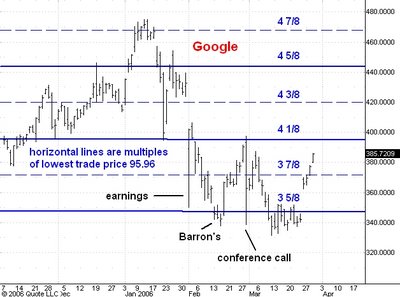
Here is a daily chart of Google.
The market has absorbed a lot of bad news over the past couple of months. On February 1 earnings news drove GOOG to a low of 350. On February 13 Barron's ran a very negative cover story on Google which drove the price down to 337. On February 28 Google's CFO made some stray remarks during a conference call with analysts to the effect that no tree grows to the sky and GOOG lost 60 points in an hour.
By the time GOOG reached the 331.55 low on March 10 it was evident from my e-mail and comments on this blog that there was a great deal of bearishness on GOOG. But what impressed me at the time is that depsite all the upset, GOOG was trading less than 20 points below the level it had reached after the February 1 earnings announcement. This was a sign that there was strong buying on bad news by people who were not likely to sell on small rallies. This in turn implied that the market would head substantially higher, to 495 I thought.
On March 24 GOOG gapped higher on the news that it would be added to the S&P 500. I regarded this as a warning that the 495 level would not be reached this cycle. But I thought then and still think now that GOOG will rally at least to the 440 level, which is the 4 5/8 multiple of its 95.96 trading low in 2004 after its IPO.
Shorter term I expect GOOG to reach resistance in the 397-400 zone at the 4 1/8 multiple of the 95.96 low before another reaction becomes likely.
T-bonds
Here is a 15 minute bar chart showing regular hours trading in the June T-bond futures.
Yesterday after the Fed announcement I said that the breakout to new lows below 109-31 looked like a fakeout to me. If I was to be right about that the market should have recovered this morning and stayed above yesterday's low at 109-27.
Instead the bonds dropped below 109-27 and and are maintaining the pace of the downmove on continuing high volume. I think this means that the June bonds will not move substantially above 110 before they drop to 108-16.
Guesstimates on March 29 , 8:50 am ET
June Bonds: So far there has been no follow-through to the downside breakout yesterday on the Fed news. This makes me think that the market is now going to rally to 111-18 before the drop into the 107-108 zone resumes.
June 10 Year Notes: Unlike the bonds the notes did not make new lows after the Fed news yesterday. I think this means that the market will rally to 107-30. After that the drop to 104 will resume.
Cash US Dollar -Euro: I expect a break to 118.90. After that a move to 125.00 becomes likely.
May Crude: The next significant move will be downward to 56.80-57.20. I think that over the next few months the market will drop to 52.00 or lower.
April Gold: I think gold will rally to 574. It is acting noticeably weaker than silver so I think the bull market here is on its last legs.
May Silver: Silver can make it up to 1108 before a substantial drop begins.
Google: I am convinced that GOOG is on its way to 405 and then to 440 although a move to 495 no longer seems likely. Support is at 363.
Tuesday, March 28, 2006
T-bonds
Here is an hourly chart of regular hours trading in the June T-bond futures.
I have been looking for a rally into the 111-24 to 111-28 zone. Instead the market has made new lows for the move down from its January high at 115-05. I am suspicious of this apparent breakout because it occurred just after today's Fed announcement. Moroever, neither the June 10 year note futures nor the September 3 month eurodollar futures accompanied the bonds to new lows for their downmoves. Finally, the bond breakout occurred on what could well be a volume climax bar.
So I am going to go out on another of my limbs and guess that the June T-bonds are going to stage a three phase rally back to the top of their current trading range before any substantial drop from current levels develops.
Crude Oil
Here is an hourly chart of May crude oil futures.
I had been looking for a rally to 65.30 but the market so far has moved a little higher to 65.80. This is actually a new high for the rally from blue point A because what looks like the high bar on the chart was in fact a data transmission error.
The 65.80 print gives the whole rally, blue A-B-C-D, a clear three stage appearance. The move up, black a-b-c-d, also has a three stage appearance. I think the next big move will be downward from here into the 56.80-57.20 zone.
US Dollar/ Euro
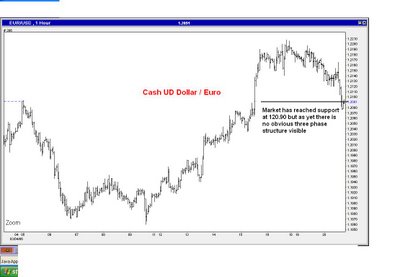
Here is an hourly chart of the cash US Dollar / Euro pair.
As you can see the market has rallied a little past 120.80 resistance in a clear three phase move. I think that the next swing will be downward to 118.90 and will be the third and final phase of the drop from 122.07. The I am expecting the market to rally to 125.00.
Be Worried. Be VERY Worried.
So exhorts Time Magazine on its latest "black" cover for the April 3, 2006 issue.
Of course, global warming has little to do with the stock market. But what interests me is not the ostensible subject of the cover itself. Instead it is the fact that Time thinks there is a good market for scare stories among its readers. This is evidence of a prevailing pessimism among Time readers, pessimism that I think will not permit any sustained drop in stock prices during the mini-bear market I think we shall experience during the second half of this year.
Indeed, if my 2006 stock market forecast is going to be off base in any substantial way I think it will be because US stock prices rise far more this year than I am currently antipating.
Guesstimates on March 28 , 8:50 am ET
June Bonds: The bonds didn’t hold support at 110-30 but I think they will hold the 110-14 level and then rally to 111-28. I think the market is on its way into the 107-108 zone over the next few months.
June 10 Year Notes: The notes should rally to 107-30. After that the drop to 104 will resume.
Cash US Dollar -Euro: Resistance at 120.80 was hit this morning in the third phase of a clear, three phase rally. I now expect a break to 118.90. After that a move to 125.00 becomes likely.
May Crude: The 65.30 level is resistance. After that is hit the next significant move will be downward to 56.80-57.20. I think that over the next few months the market will drop to 52.00 or lower.
April Gold: I now think gold will only rally to 574. It is acting noticeably weaker than silver so I think the bull market here is on its last legs.
May Silver: Silver can make it up to 1108 before a substantial drop begins.
Google: I am convinced that GOOG is on its way to 405 and then to 440 although a move to 495 no longer seems likely. Support is at 356.
Monday, March 27, 2006
Crude Oil
Here is an hourly chart of pit trading in May crude oil futures.
I have changed my short term expectation for this market. The rally from the 61.25 level still has not assumed a classic three phase shape. For this to happen the market will have to move up to 65.30. Once it reaches that level I shall be looking for a move down into the 56.80-57.20 zone.
Gold
Silver
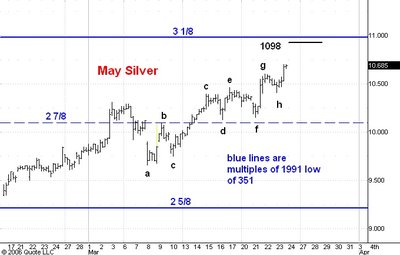
Here is an hourly chart showing pit trading in May silver futures.
The market has rallied as far as 1092 vs. my target of 1098 at the 3 1/8 multiple of the 351 low in 1991. Note that the current upswing from point h is longer than the previous two upswings. This together with the fact that gold still has some way to go to get to my current 574 target means that silver will probably rally to 1108 before beginning a big reaction.
T-bonds
Here is a 15 minute bar chart of June T-bond futures.
I think this market will soon enter the third and final phase of its rally from the 110-13 level at point A in blue. Note how the second phase ( blue B to C) itself is taking on a three phase appearance. The third phase, black c to d, should stop at support near 110-30 and thus be shorter in time and price that the first phase, black a to b. This together with the fact that volume is visibly dropping on the break from blue point B is more evidence that the market is headed for 111-28.
After 111-28 is reached the bonds are likely to drop below 110.
Basic Advances and Declines
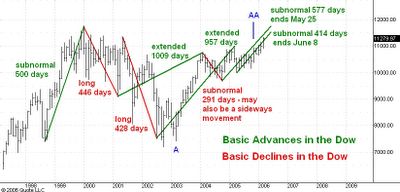
Basic Advances and Basic Declines are intervals of time, usually (but not always) starting at bear market lows and bull market highs respectively. Lindsay observed that the durations of these time intervals seemed to cluster around certain specific numbers. He grouped these numbers into categories. For example, a basic advance could either be subnormal, normal, long or extended. He made several other observations about basic advances and declines which help to anticipate the length of the current one. For more on this theory you should read Lindsay's article "Counts from the Middle Section" which is reprinted in the booklet "Selected Articles by the Late George Lindsay".
The chart above records the monthly ranges of the Dow Jones Industrial average since 1998. I have drawn green and red lines on the chart showing my current estimates of the postions of Lindsay's basic advances (green lines) and declines (red lines).
In my 2003, 2004, 2005 , and 2006 stock market forecasts I worked under the hypothesis that a basic advance began in March 2003 at point A in the chart above. If this were correct then this basic advance should have ended after March 2005 but no later than December 2005, point AA in the chart. As you can see the Dow has gained strength during these first three months of 2006 and this has convinced me to set aside this hypothesis.
Instead I now think that the Dow is nearing the end of two subnormal basic advances, one which began from the October 25, 2004 low and the other from the April 20, 2005 low. Both these subnormal advances followed on the heels of extended advances as they should. I think subnormal advances make sense here because any longer advance would put the top further away from the 15 year, 3 months projection of a major top for January 2006. Longer advances would also be inconsistent with the imminent completetion of the Three Peaks and a Domed House formation.
The best agreement I can come up with for the end of these two subnormal advances is the May 25 - June 5 2006 time period. This is spot on with the standard time projection from point 14 of the Domed house of 7 months 10 days. This makes me think that my projection of a bull market top for April 25 is now somewhat less likely to be correct than the projection of a top for roughly June 5.
Guesstimates on March 27 , 8:50 am ET
June Bonds: The bonds are headed for 111-28. I think the market is on its way into the 107-108 zone over the next few months.
June 10 Year Notes: The notes are headed for 107-30. I think notes will reach 104 or so in a few months.
Cash US Dollar -Euro: Resistance is at 120.80. Another break to 118.90 should follow this rally. After that a move to 125.00 becomes likely.
May Crude: The next significant move will be downward to 56.80-57.20. I think that over the next few months the market will drop to 52.00 or lower.
April Gold: I now think gold will only rally close to its February top at 579. It is acting noticeably weaker than silver so I think the bull market here is on its last legs.
May Silver: Silver has nearly reached 1095. I think gold has a more to go on the upside so I now think silver can make it up to 1108 before a substantial drop begins.
Google: I am convinced that GOOG is on its way to 405 and then to 440 although a move to 495 no longer seems likely. Support is at 356.
Friday, March 24, 2006
S&P Update
Here is an updated 15 minute chart of the June S&P e-mini futures.
This morning I thought that the sudden reversal from 1308 heralded a breakout to 1328. Instead the market dropped below yesterday's close (dashed line) which meant that this morning's move was another fake-out.
It now looks like today's high ended the third phase of a correction from 1305.25, labeled dd -ee-ff-gg on the chart. This upward correction was itself the middle, upward phase of a larger three phase correction downward from the 1321 level with the blue labels a-b-c-d. I think point d will develop near what I see is support around the 1297 level. After point d is reached I expect a move upward to 1328 and higher.
T-bonds
Here is an hourly chart of June T-bond futures.
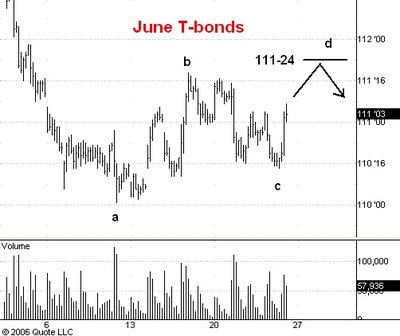
I was expecting the market to move below 109-31 but the news this morning gave it a second wind. I now think that the move up from yesterday's 110-14 low is part of the third and final phase of a three phase reaction that began from point a. I am expecting the high at point d, roughly at the 111-24 level. After that the market should move below 110.
S&P
Here is a 15 miute chart of the June S&P e-mini futures.
Yesterday I explained why I was still looking for a move down to 1297. This morning the market dropped to 1308 but then made a high volume U-turn. Since I am still very bullish I have to respect the market's action and now will expect a move to 1328. If I am right about this I don't think the market will drop below yesterday's close at 1312 (dotted line).
One More Nail
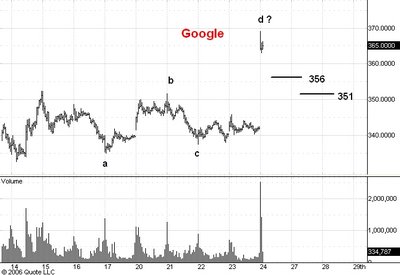
Here is a 15 minute chart of Google.
After the close yesterday it was announced that on March 31 GOOG will join the S&P 500 index. I have to admit that this rubs my contrarian nerves the wrong way.
For one thing, it is a solid piece of evidence that the bull market in the averages is nearing its end. My prediction has been for a top on April 25 with the potential of delaying that until June 5. So the Google announcement adds to my confidence that the upswing to 1350 will be the last of the bull market which started in 2002.
As far as GOOG itself goes, this is good news in the short run but looking ahead more than a couple of months I think it means that 475 was the bull market top in GOOG. The best we can expect now is a rally into the upper 1/3 of the 331-475 trading range, perhaps to 440 or so, followed by a break below 300 in GOOG.
I still think the 331 low reached on March 10 will hold and that the market is on its way to 44o or so. Looking at the chart above this post you can see that the swing from c to d is longer in price than the swing up from a to b. If GOOG is as strong as I think then any reaction from today's high should be no greater than the length of the swing down from b to c, i.e about 13 points. This would put support near 356. My secondary support is at 351 at which price a drop from 369 would be 18 points, the length of the biggest reaction so far in the move up from 331.
Guesstimates on March 24 , 8:50 am ET
June Bonds: The bonds are headed downward. Resistance today is still at 111-08. I think the market is on its way into the 107-108 zone over the next few months.
June 10 Year Notes: The notes are headed downward from here. I think notes will reach 104 or so in a few months.
Cash US Dollar -Euro: A bounce from 119.60 is likely but probably will only be 100 points or so. This is still only the first phase of a drop from 122.07 and the third and final phase will probably reach 118.90. Once all three phases are complete I think the market will move to 125.00.
May Crude: I thought the rally would stop at 63.25 resistance but it went a full dollar higher. Even so, the next significant move will be downward to 56.80-57.20. I think that over the next few months the market will drop to 52.00 or lower.
April Gold: I now think gold will only rally close to its February top at 579. It is acting noticeably weaker than silver so I think the bull market here is on its last legs.
May Silver: I think that silver is headed for 1095.
Google: I expect support at 334 to hold and after that Google should rally to 358 or higher. I am still convinced that continuation up to 405 and then to 495 is very likely.
Thursday, March 23, 2006
US Dollar / Euro
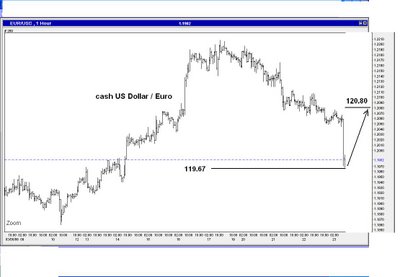
Here is an hourly chart of cash trading in the US Dollar / Euro pair.
I thought this market would rally from support at 120.90 to a lower top and then drop to 120.00, thus completing a three phase reaction. As you can see from the chart no rally developed and since then we have dropped below support at 120.20. I think this market will hold 119.60 and then rally into the 120.70 - 120.90 zone. From there the third phase of the drop from 122.07 should carry prices down to 118.90.
Once this correction from 122.07 is over I am looking for a rally to 125.00. I shall stick with that view unless prices break below the 118.25 level.
S&P
Here is a 15 minute chart of the June S&P e-mini futures.
I don't think the drop from point ee is over yet. The swing from ee to purple point a does not have a three phase look to it and worse, the volume on the drop from ee to a was high and increasing. Morevover, the rally a-b-c-d has a clear, three phase look to it and occurred on low volume. It ended with a minor volume climax at point d.
I think the market is headed down from here, probably to support near 1297. Once this correction is complete I expect a move that will carry the S&P's to 1350 by the end of April.
Silver
Here is an hourly chart of pit trading in May silver futures.
I believe that the market is on its way to 1098 from which point a drop of $2.00 or so is likely.
I have labeled several swings on the way up from point a. The main this to observe is that we see a clearly defined sequence of higher lows. The second fact that interests me is that the swing up from f to g exceeded the previous swing up d to e in both price and time. The subsequent correction g to h was shorter in price and time than the preceeding corretion e to f. This tells me that the market is gathering strength. There is every reason to believe that the 1098 level will be reached soon.
Nasdaq Composite
The sequence of higher lows is telling us that the bull market which started from the 1108 level in 2002 is still alive and well. My current upside target is the 2550 level which is just a tad lower that 1/2 the all time high in this index at 5133 in 2000.
T-bonds
Here is an updated 15 minute bar chart of the June T-bond futures. I disussed this chart yesterday.
I was expecting a rally to point g at 111-08 but this morning the market only was able to make it back to 111-04. Subsequently we have seen high volume as prices have accelerated downward. This tells me that the market is on its way below 109-31.
Gold
Here is an hourly chart of pit trading in April gold futures.
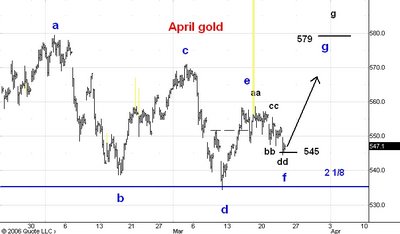
I believe that the threee phase correction marked by the blue letters a-b-c-d is over and that it will be followed by a three phase move upward. I have been predictin a move to 598 but gold is underperforming relative to silver so I now think that the February top near 579 is a better target.
You can see that I have marked a three phase correction downward aa-bb-cc-dd in black letter. This morning the market reached support at 545 and I think the next move will be upward to 579. This will be the third and final phase of the entire move up from point d at 534.
Crude Oil
Guesstimates on March 23 , 8:50 am ET
June Bonds: The bonds are headed downward. Resistance today is t 111-08. I think the market is on its way into the 107-108 zone over the next few months.
June 10 Year Notes: The notes are headed downward from here. I think notes will reach 104 or so in a few months.
Cash US Dollar -Euro: Support is 120.20 but so far we have seen only the first phase of a three phase correction. Resistance is 121.60. Once all three phases are complete I think the market will move to 125.00.
May Crude: The market is now headed down to 56.80-57.20. I still think that over the next few months the market will drop to 52.00 or lower.
April Gold: I still think gold is headed for 598. It is acting noticeably weaker than silver so I think the bull market here is on its last legs.
May Silver: I think that silver is headed for 1095.
Google: I expect support at 334 to hold and after that Google should rally to 358 or higher. I am still convinced that continuation up to 405 and then to 495 is very likely.
Wednesday, March 22, 2006
T-bonds
Here is a 15 minute chart of the June T-bond futures. I last commented on this chart here.
I think the market has just finished the second, downward phase (from e to f) of an upward, three phase correction d-e-f-g. I am expecting a rally up to 111-08 followed by a break below 110.
S&P
Here is a 15 minute bar chart of regular hours trading in the June S&P e-mini futures.
In my last post I thought the market was on the verge of a breakout above 1321. As you can see the market instead took a dive back below support at 1309 and stopped a little above what I think is secondary support at 1303. The question now is whether or not today's early morning low at 1304.75 will hold.
Right now I think the evidence points to a move down to 1297 or so from the rally high so far of 1313.25. First note that the volume on today's rally has shown a definite tendency to decrease, in contrast to the volume pattern on yesterday's early rally. Second, the volume peaks on down bars during the correction from point aa have steadily grown higher, showing that selling pressure is growing. Third, the rally from dd has so far been smaller that the previous rally from bb to cc. It would equal the size of bb to cc at the 1315.50 level. Finally, the break from bb to cc was faster and deeper than the initial break aa to bb.
All in all, this is a short term bearish picture and leads me to expect a drop to 1297 before we see a rally into the 1325-28 zone and higher.
IBM
Here is a weekly chart of IBM.
My original upside target for IBM was 106-08 but I now think it will only make it up to 100 or so.
Chicago Board of Trade
Here is a daily chart of the Chicago Board of Trade.
CBOT is about to make a new high for trading since its IPO last year. I am revising my upside target slightly to 148 from the 142 level cited in my last post of CBOT.
Microsoft
Here is a weekly chart of Microsoft since its 2001 low at 20.12. This chart shows MFST adjusted for divident payouts so it shows an adjusted low near 18.00 instead of the actual print low of 20.12. In doing my analysis I prefer to use the print low rather than the divident adjusted low.
The thing that jumps out at me from this chart is that MSFT has been going sideways for 3 and 1/2 years now. During this time it has made a succession of higher lows on the weekly chart. I think this action forecasts a breakout above the 28 level. The first upside target would be roughly 33, at 1 and 5/8 times the 20.12 low.
Chicago Merchantile Exchange
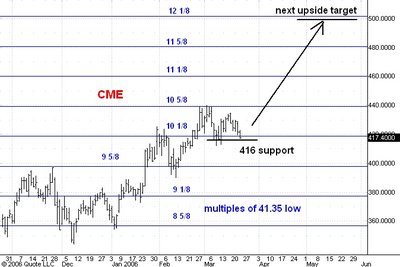
Here is an updated daily chart of the Chicago Merchantile Exchange.
CME has been leading the bull market upward for the past three years and as yet shows no sign of weakness. It has alreading exceeded my initial bull market target of 411 and has reached the secondary target at 441. Right now I think support at 416 will hold and that the market will proceed upward to my next target of 500.
Sears Holdings
Here is a daily chart of Sears Holdings. I last commented on SHLD several months ago.
As you can see the market has reached and exceeded by a bit my 137 upside target. I think the current reaction will hold support at 128 and be followed by a move to 147.
Schadenfreude
"Schadenfreude" is a German word which roughly means "happiness over the misfortunes of other people".
This anonymous commenter has chosen to snipe at me from behind the cover of his internet bush, not having even the courage to tell us all his name.
When I read or hear a remark like this about my work I know instantly that that person is and will continue to be a life-long loser at the game of speculation. Indeed, the only joy he gets from the game comes from seeing other people take postions which are later trashed by the market's action. This Schadenfreude reaffirms his conviction that no one can win at the game of speculation, so it is o.k. if he himself is a loser.
Anyone who actively participates in the market regularly has the experience of the market moving contrary to his or her best estimate of its likely direction. The key to success is to recognize these "mistakes" early enough so that the damage can be limited.
Guesstimates on March 22 , 8:50 am ET
June Bonds: The bonds are now headed downward. Resistance today is t 111-08. I think the market is on its way into the 107-108 zone over the next few months.
June 10 Year Notes: The notes are headed downward from here. I think notes will reach 104 or so in a few months.
Cash US Dollar -Euro: I think the market will bounce up to 121.60 and then drop to 120.20. After that I expect a move to 125.00.
May Crude: The market is now headed down to 56.80-57.20. I still think that over the next few months the market will drop to 52.00 or lower.
April Gold: I still think gold is headed for 598. It is acting noticeably weaker than silver so I think the bull market here is on its last legs.
May Silver: I now think that silver is headed for 1095.
Google: I expect support at 334 to hold and after that Google should rally to 358 or higher. I am still convinced that continuation up to 405 and then to 495 is very likely.
Tuesday, March 21, 2006
US Dollar - Euro
Here is an hourly chart of the cash US Dollar - Euro pair.
This morning I estimated that support would be found at 120.90. As you can see the market has dropped to that level and is now trading sideways near there.
I still think this market is headed for 125.00 and if I am right about this then the drop we have seen from the 122.05 level is a correction within a bigger uptrend. Now most corrections show a clear, three phase structure by the time they are complete. This move down from 122.05 does not yet show two distinct down phases yet, so I think we have only seen the first down phase within a larger correction. My best guess now is that the market will rally to 121.60 in the second phase of its correction and then drop to 120.20 in the third and final phase of the drop from 122.05.
S&P
Here is an updated 15 minute bar chart of regular hours trading in the June S&P e-mini futures.
During the past half hour the market has climbed steeply on very high volume. It had dropped as low as 1310.75 this morning, not far from my estimate of support at 1309. Since I am still very bullish on this market, I think the message of the high volume advance from 1310.75 is that the drop from 1321.50 is over and that the market will soon reach the 1325-28 zone.
T-bonds
Here is a 15 minute bar chart showing regular hours trading in the June T-bond futures.
The market has bounced off of 111-16 resistance after a three phase rally which I discussed here and here and here and here .
The intial drop from the 111-19 high is labeled a to b on the chart. Notice how the second downleg, the one starting from c, has already exceeded leg a - b in both extent (price) and duration (time). This is a bearish indication. The second bearish indication is the marked increase in volume which has accompanied the drop from c.
This tells me that the move down from c will break the early March low of 109-30 in electronic trading. The next significant support below that low is near 108-16.
Guesstimates on March 21 , 8:50 am ET
June Bonds: The bonds have reached my 111-16 target and are now headed downward. I think the market is on its way into the 107-108 zone over the next few months.
June 10 Year Notes: The notes are headed downward from here. I think notes will reach 104 or so in a few months.
Cash US Dollar -Euro: The market is headed up to 125.00. Support is at 120.90
May Crude: The market is now headed down to 56.80-57.20. I still think that over the next few months the market will drop to 52.00 or lower.
April Gold: I now think gold is headed for 598 or so after having completed a three phase drop to 534.
May Silver: I now think that silver is headed for 1095.
Google: Google should rally to 358 or higher. I am still convinced that continuation up to 405 and then to 495 is very likely.
Monday, March 20, 2006
Crude Oil
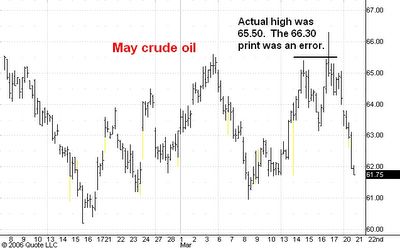
I had been looking for a move to 66.20 but the market only managed to reach the 65.50 level before turning lower. ( The price bar which has its high at 66.30 contains a "bad tick" and records a data transmission error.)
As you can see the market today broke below its March 16 session low and is accelerating downward. I think this means that it is now heading for the 56.80- 57.20 zone.
Advancing Issues and the Upcoming Top
As I said in my previous post on Lindsay's Domed House pattern, there is some uncertainty about the timing of point 23 which should be the top of the bull market which began from the October 2002 lows in the major averages.
My best estimate currently is that this high will occur near April 25 plus or minus a few days. There is one thing which would change my mind about this and make me expect the top in June instead of in late April.
I have noted previously on this blog the following interesting fact. When the stock market averages make a new bull market high that is accompanied by multi-month high in the 10 day moving average of the number of advancing issues on the New York Stock Exchange then the final price top is at least one month and often two months away.
Above this post you will find a chart of the daily readings of the NYSE advancing issues number (black line) and well as the 10 day (red line) and 20 day (blue line) moving averages of this number. Notice that the 10 day moving average is still below its peak for 2006 which is depicted by the dashed red line. Should this peak be exceeded over the next few weeks I would then believe that the bull market top lies at least one month and maybe two months ahead.
Of even more potential interest is the 20 day moving average (blue line). If this moving average makes a new high for 2006 (by moving above the dotted blue line) then I would conclude that the bull market top lies at least 2 and possibly 4 months ahead.
If sometime during the next few weeks either or both of these moving averages make new highs for 2006 I would conclude that point 23 would develop in June and not in April. I might add that the ideal 7 month and 10 day time projection for the Domed house from point 14 would predict point 23 for June 5.
Domed House Update
Here is a daily chart of the cash S&P 500 showing its current position within George Lindsay's Domed House pattern. I've been tracking this and other similar examples of Lindsay's
Three Peaks and a Domed House formation over the past couple of years.
The market is pretty much on schedule and I think it is heading higher into the peak of the domed house at point 23. I've projected this top for April 25 at the 1350 level. At the moment this looks like a good estimate.
The only real risk I see is that the market turns out to be stronger than I am expecting and instead puts in its point 23 high in June instead of late April. If this were to happen I would think the top would be near 1400 rather than 1350.
In this post about the Domed House in the S&P I explained that the ideal time projection for point 23 from point 14 of 7 months and 10 days would put the top on June 5. I also explained why at the time I still preferred April 25 as the likely date for point 23.
S&P
Here is a 15 minute interval line chart for the June S&P e-mini futures.
The break from this mornings high has occurred on increasing and relatively high volume. From this I conclude that the market is headed at least for 1309 and possibly to 1303. Once this drop is complete I think a rally to 1325-28 and higher will be the next development.
Guesstimates on March 20 , 8:50 am ET
June Bonds: The bonds have reached my 111-16 target and are now headed downward. I think the market is on its way into the 107-108 zone over the next few months.
June 10 Year Notes: The notes are headed downward from here. I think notes will reach 104 or so in a few months.
Cash US Dollar -Euro: The market is headed up to 125.00.
May Crude: The upside target for this rally is now 66.20. I still think that over the next few months the market will drop to 52.00 or lower.
April Gold: I now think gold is headed for 598 or so after having completed a three phase drop to 534.
May Silver: I now think that silver is headed for 1095.
Google: Google should now rally to 358 or higher. I am still convinced that the next significant development will be a rally to 405 and then to 495.
Friday, March 17, 2006
Guesstimates on March 17 , 8:50 am ET
June Bonds: The bonds have reached my 111-16 target and are headed downward from there. I think the market is on its way into the 107-108 zone over the next few months.
June 10 Year Notes: The notes have exceeded resistance at 107-12 by 13 ticks but I think they are headed downward from here. I think notes will reach 104 or so in a few months.
Cash US Dollar -Euro: The market has accelerated past 121.10 so I think it is headed up to 125.00.
May Crude: The upside target for this rally is now 66.20. I still think that over the next few months the market will drop to 52.00 or lower.
April Gold: I now think gold is headed for 598 or so after having completed a three phase drop to 534.
May Silver: I now think that silver is headed for 1095.
Google: Google should hold 338 and then rally to 358 or higher. I am still convinced that the next significant development will be a rally to 405 and then to 495.
Thursday, March 16, 2006
Here is a 15 minute chart of Google. I last commented on this chart here.
I think that GOOG has completed a three phase drop to support at 338. The whole move ended with a volume climax at point d, the biggest volume by far on a down bar since the top at point a.
The next development should be a rally to 358 or higher.
T-bonds
Here is a 15 minute chart of June T-bond futures. I last discussed this market here.
The bonds have finally reached my 111-16 target. In doing so a clear three phase rally is visble ( a-b-c-d). Moreover the volume on this last upleg shows a marked tendency to drop as the market climbed to new rally highs.
I think this means that the corrective phase is over and that a move below 110-00 is imminent.