Sunday, July 31, 2005

Three Peaks and a Domed House


A couple of months ago I explained in this post, Three Peaks and a Domed House in the Dow , how the movements in the Dow industrials over the past 18 months can be interpreted as an example George Lindsay's Three Peaks and a Domed House formation. I'd like to update my thinking on this situation now.

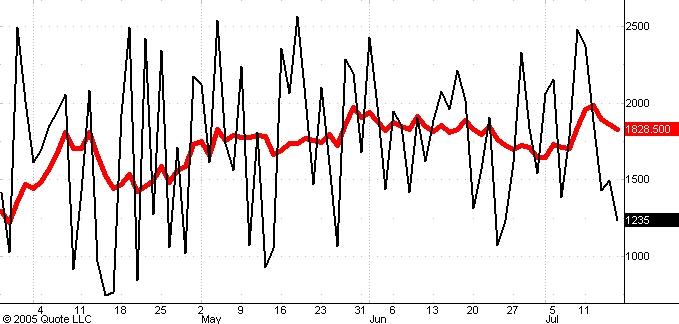
The first chart you see above this post is a schematic which illustrates the standard example of a three peaks and domed house formation. Lindsay once estimated that the Dow was in the midst of such a formation roughly 60% of the time over the 120 years of stock market history he had examined. Major examples of the formation typically last 20-24 months from start to finish, so if you can recoginize one in its early stages you have a good market roadmap for the next year or two.

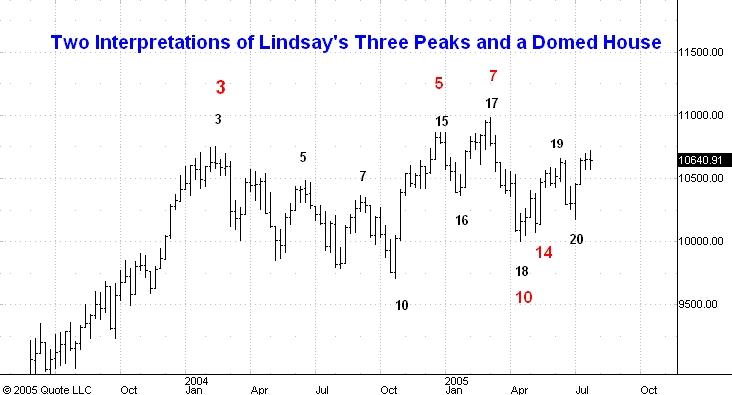
Right now I see two simple interpretations of the Dow's movements since February 2004 as a three peaks formation.

In the first interpretation black numerals match points on the weekly chart of the Dow you see above to the corresponding points in the schematic. The three peaks, labeled 3, 5 and 7, occurred between February and September 2004. This was a 6 1/2 month time span and qualifies this as a "major" three peaks formation. Point 10 occurred in October 2004 and Lindsay's "five reversals" are labeled 15 - 20. If this interpretation is correct then the Dow has begun a rally to the domed house house which will look a bit like a classic "head and shoulders" and eventually carry the labels of points 21 - 25.

In this interpretation there is no obvious point 14 (and hence no black numeral 14). In such a case Lindsay was willing to count the 7 month 10 day time period beginning from one of the lows within the five reversals. This would predict that point 23 or point 27 will come sometime between September 2005 and February 2006. The peak of the current bull market would thus be due during that time.

The second interpretation uses red numerals to match points in the Dow chart to points in the schematic. I like this interpretation better because it contains a very clearly identified point 14, the low of May 13. Counting forward 7 months and 10 days we arrive at Demember 23 as the likely time for point 23, the peak of the domed house.

Both interpretations say the the top of the current bull market is due sometime between September 2005 and February 2006. At what level might the top occur? To make a guess at this we work backwards using Lindsay's theory as a guide.

Lindsay pointed out that after the completion of the domed house the Dow generally drops to roughly the level of the correponding point 10, in this case either the 9700 level or the 10000 level. I think this drop will occupy most of 2006. If this drop amounts even to only 20% and goes to 9700, the intervening high in the Dow (point 23) should be above 12000.
 

Friday, July 29, 2005

Google


In my last post on Google I predicted that the 1/2 point of the current box at 292 would hold and that the market would then take GOOG up to 343.

Today GOOG has traded well below 292 so I must conclude that it is headed for the bottom of its current box near 267. Once this level is reached I expect GOOG to turn upward again and rally to 343.
 

Bond and Note Update


In this morning's guesstimate I said that the September T-bond and 10 year note futures should have only modest reactions before continuing the uptrend that began from last week's lows. The updated hourly charts you see above show that I was wrong about this.

The steep reaction that has developed is bigger than the first reaction and this tells me that the original estimates of rally boxes I posted here are wrong (not an unusual event early in a trend). My best guess now is that yesterday's high defined the top of the first rally box.

In any event I think that today's negative reaction to the GDP news, consumer sentiment numbers and Chicago purchasing manager's report is simply giving weak longs an excuse to sell and encouraging the bears to short more. I think this is strengthening the bullish technical condition of the market and that prices will move generally higher next week.

In the meantime I think that the 115-04 level in the bonds and the 110-30 in the notes will again prove to be strong support and be worst we see on the downside.
 

Guesstimates on July 29, 8:50 am ET

S&P: The market will hit 1257 in a couple of days; meantime 1232 is support.

Bonds: The market has nearly reached 116-18. I think it will hold support at 116-02, the top of the first rally box andthen move to the top of the first rally box near 116-26 before a more substantial reaction begins.

10 Year Notes: Should hold support is at 111-13 and rally to 111-26 to 111-28.

Eurocurrency: Will hold support is at 120.90 and next step up should carry to 122.80.

September Crude: Support is at 59.70 and upside target is 62.10.

Gold: Support is at 420 and next upside target is 436 and 450 after that.

Google: 292 is support and the next move up will reach 343.
 

Thursday, July 28, 2005

Crude Oil


As you can see from the updated hourly chart of September crude oil shown above the market has bounced three times off of resistance at 59.70. But a now on its fourth try it is accelerating above that level. I have to conclude that September crude is headed for the top 0f the box at 62.10. The contract high was 62.90.
 

Bonds and Notes


Here are updated hourly charts of the September T-bond and 10 year note futures showing only the pit trading activity. I have superimposed purple lines showing my current estimates of the box postions for the upmove which I think is just beginning. These boxes are relatively small, only 38 ticks in the bonds and 18 ticks in the notes, so it won't surprise me if I have to enlarge them later.

In any case I think the initial move in both markets will be to the 1/2 point of the second purple box, about 116-18 in the bonds and 111-26 in the notes. This would be classic box behavior at the start of a rally. The next break will probably be a single purple box deep when it starts.

Remember that I expect the bonds to trade into the 121-123 range and the notes to 116 over the next few months. My 2005 bond forecast predicted a top for August but right now it looks like this top will be delayed a bit.
 

Creeping Higher


Here is a daily chart of the cash S&P. It shows my estimate of the bull market boxes that started from the 768 low in October 2002 and are 186 points high.

I think the market is on its way to the top of the current box near 1320. In fact I suspect that the 1/2 point of the next box around 1415 may well be seen before the next bear market sets in.

In any event, the market continues to creep higher. I think the lack of activity at new highs for the bull market shows continuing skepticism about the uptrend. Certainly the technical analysts I know keep trying to short the market based on the various divergences they see now.

I don't think we'll see an important top until volatility and volume increase dramatically. My best guess is that this will happen over the next few months as investors start to fear being left behind by rising prices.
 

Guesstimates on July 28, 8:50 am ET

S&P: The market will hit 1257 in a couple of days; meantime 1227 is still support.

Bonds: The market Will hold the low of its current box at 115-04 and then rally to begin a move 116-18.

10 Year Notes: will hold 110-30 and then rally to 111-26.

Eurocurrency: will hold support is at 119.90 and then rally into the 125-126 range.

September Crude: Trading below resistance around 59.70 and the next move will be to 54.70, the 1/2 point of the next box.

Gold: Support is at 420 and the market has now started a move to 450.

Google: 292 is support and the next move up will reach 343.
 

Wednesday, July 27, 2005

Google Posts

Here is an index of the posts I have made on Google and Baidu.com :

POSTS IN 2007

Google and Baidu - October 9
Baidu - September 19
Google - July 10
Baidu - July 10
Baidu.com - March 7
Google - March 7
Google - February 7
Baidu.com - February 2
Google - February 2
Google - January 24
Google - January 22
BIDU - January 12

POSTS IN 2006

Baidu - November 21
Google - November 21
Google - November 2
Baidu - November 2
Google - October 23
Google - October 20
Google and Fibonacci - September 26
Baidu - September 26
Google - August 2
Baidu - August 2
Google and Fibonacci - July 26
Google - June 28
Baidu - June 7
Google - June 7
Baidu - June 2
Google - June 2
Google - May 16
Baidu - May 16
Baidu Update - May 12
Baidu - May 11
Google - May 11
Baidu - May 10
Baidu.com - May 5
Google - May 1
Google - April 25
Google - April 21
Google - April 10
Google - April 7
Google - April 5
Google - March 31
Google - March 29
One More Nail - March 24
Google - March 16
Google - March 15
Google - March 14
Google - March 13
Google - March 10
Google - March 9
Google - March 8
Google - March 7
Google - March 3
Google - March 2
Google - February 28
Google - February 27
The Google Test - February 16
Google - the Sinking Ship? - February 13
Google - February 8
Gagging on Google - February 1
Baidu - January 30
Google - January 26
Google - January 24
Google - January 23
Google Update - January 20
Google - January 20
Google - January 18
Google - January 11
Calm Before the Storm - January 9
Google - January 4

POSTS IN 2005


Google - December 21
Google Update - December 19
Google - December 19
Google - December 12
Google - December 8
Google - December 5
Google - November 29
Baidu - November 16
Google - November 16
Google - November 7
Google - October 31
Baidu - October 25
Baidu - October 21
Google - October 21
Google - September 28
Baidu.com - September 28
Baidu Boxes - September 16
Bearish on Baidu ( What's New? ) - September 16
Google - September 15
Baidu on the Close - September 14
Wall Street Hates Baidu - September 14
Baidu Update - September 13
Baidiu.com - September 12
Baidu Boxes - September 9
Google Boxes - September 9
Bad Mouthing Baidu - August 27
Going Up From Here - August 24
New Baidu Boxes - August 23
Bye Bye Baidu ? - August 22
More Fun With Baidu - August 18
Another Googlestimate - August 18
Borrowing Baidu.com - August 15
Google - August 11
Fun With Baidu.com - August 9
Google - August 9
Baidu, Baidu - August 8
Google - August 2
Google - July 29
Google Boxes - July 27
Google - July 19
Google - July 12
Google Price Boxes - July 5
Laughing at Google - June 26
Googlestimate - June 23
Google - June 15
Squawk Blog Makes Fun of Google - June 13
Google Update - June 12
Is Google Overpriced? - June 8
Google's Next Reaction - May 30
Google on May 25 - May 25
Google on May 18 - May 18
How High Can Google Fly - April 25
The Story of Google - April 22
 

Gold


Here's an hourly chart of August gold showing both pit and electronic trading.

You can see that the market rallied back above the 1/2 level of its current box, then dropped back to that level and has now started to accelerate upwards. This tells me that the market is headed for much higher prices.
 

Why 125 - 126 ?


I have been predicting a rally in the eurocurrency into the 125-126 range. I thought you might be interested in the reasoning behind this projection.

In this post I explained why the eurocurrency would probably start a big rally. In the daily chart above for the September futures I have drawn the bear market boxes down from the 136.87 high of last December 31 in red. In purple I have drawn what I think will be the boxes controlling the rally from the recent 119.00 low.

The most basic idea is that the rally should be similar in extent to the last big rally which carried the market up 773 ticks from 127.37 to 135.10. Adding 773 to 119.00 we get 126.73, just below the February 7 low at 127.37 which is itself a natural resistance level. Note also that a halfway retracement of the drop from 135.10 to 119.00 would carry the market up to 127.05.

I estimate that the boxes for this rally are 387 ticks high. The top of the second box is therefore at 126.74, just a tick above the 126.73 projection described in the last paragraph. I think this is the upper limit on any rally.

But the drop from 125.10 to 119.00 was bigger than the first drop of the bear market from 136.87 to 127.37. So I would not expect this rally to go as far as the first 773 tick rally. If it doesn't then a logical stopping point would be the 1/2 division of the next higher rally box. This is the 124.80 level.

So I am confident that the market will move up at least to 124.80, probably past it, but the market will not reach the outer rally limit of 126.73. Thus 125-126 seems a good ballpark estimate to me.
 

Google Boxes


I think speculation is at least as much art as it is science. This is clear to anyone who applies box theory to calculate support and resistance levels. Box positions are usually obvious in retrospect, but you can't make money by predicting the past. Profits can only be earned by making educated guesses about the future where nothing is obvious or easy.

With this in mind I have been mulling over the box situation in Google. The hourly chart above shows my new estimate of GOOG boxes which are 50.37 points high. I like this estimate principally because the 1/2 point of the current box (red dashed line) seems to be true "center of gravity" for the past 7 weeks.

I have been saying that support in GOOG is at 280, but now I think that the market is unlikely to drop much below this 1/2 level at 292. If I am wrong about this then a drop all the way to the bottom of the current box near 267 will become likely.

In any case I now think that the next upswing in GOOG will probably carry to the 1/2 point of the next box near 343.
 

Guesstimates on July 27, 8:55 am ET

S&P: The market will hold above 1227 and then move up to 1257 this week.

Bonds: The market will hold the low of its current box at 115-04 and then rally to begin a move 116-18.

10 Year Notes: Will hold 110-30 and then rally to 111-26.

Eurocurrency: Will hold support is at 119.90 and then rally into the 125-126 range.

September Crude: Hit resistance around 59.70 yesterday and now will move to the next downside target, the 1/2 point of the next box at 54.70.

Gold: Support is at 420 and the market has now started a move to 450.

Google: 280 is support and the next move up will reach 327.
 

Tuesday, July 26, 2005

Bullish Bond Boxes


Here is a daily chart of the September T-bond futures. I have drawn the boxes which have controlled the bull market which began in May 2004 from the 103-02 level in the June '04 contract.

As you can see the market's high on June 3 occurred at the top of the fourth box and during the past six weeks the bonds have dropped to the bottom of that same box. As I pointed out in an earlier post, sentiment among bond market timers is very negative.

The combination of these two facts leads me to expect a move up at least to the 1/2 point of the next box near 121-16 and quite possibly to the top of that box near 123-16.
 

Crude Oil


As you can see from the updated hourly chart September crude oil has rallied to the 1/2 point of its current box. The next significant move will be downward to the 1/2 point of the next box near 54.70.
 

Eurocurrency


The September futures didn't quite make it down to 119.90, the bottom of the box but buyers have become aggressive as evidenced by the widening of the last pair of hourly bars on the upside. I conclude that the next leg up has started and will carry the market to the top of the next box near 123.70.
 

Guesstimates on July 26, 8:45 am ET

S&P: The market will hold above 1227 and then move up to 1257 this week.

Bonds: The market will hold the low of its current box at 115-04 and then begin a move 116-18.

10 Year Notes: Will hold 110-30 and then rally to 111-26.

Eurocurrency: Will hold support is at 119.90 and then rally into the 125-126 range.

September Crude: Will hit resistance around 59.70 and then move to the next downside target, the 1/2 point of the next box at 54.70.

Gold: Support is at 420 and the market has now started a move to 450.

Google: 280 is support and the next move up should reach 327.
 

Monday, July 25, 2005

S&P


The hourly chart of the September S&P futures you see above shows that the market has yet to escape from its trading range bounded by the 1/2 point of the current box at 1246 and the bottom of the same box at 1224. I think the market will have to revisit the 1227 level before it will be able to break above 1246. Once this happens the next stop on the upside will be 1257.
 

Crude Oil


Here is an updated hourly chart of September crude oil. The market bounce off the bottom of its current box at 57.20 and will probably rally to the 1/2 division point at 59.60. From there I think crude will drop to the 1/2 point of the next boxe at 54.70.
 

Eurocurrency


I thought that the September eurocurrency would hold support at the 1/2 point of its current box but today's price action has changed my mind and I now expect a drop to the bottom of the box near 119.90 before the market resumes its rally. I still think we will see a move up into the 125-126 range before the bear market resumes.
 

Bonds and Notes


Here are updated hourly charts of the September T-bond and 10 year notes futures.

Last Thursday both markets reached their downside targets of 115-04 and 110-30. I believe Thursday's lows marked the end of the drop from the June 3 top of 119-23 in the bonds and 114-21 in the notes. The next big move will be upward. I expect the bonds to trade into the 121-123 range and the notes to reach the 116 level. The upcoming move will probably be the final leg of the bull market which began from the May 2004 lows at 103-02 in the bonds and 107-25 in the notes.

Over the next few days the bonds should rally to the top of their current box at 116-18 and the notes to the 1/2 point of the box at 111-26. These levels represent 1 box rallies from last week's lows.
 

Guesstimates on July 25, 8:50 am ET

S&P: The market will hold above 1227 and then move up to 1257 this week.

Bonds: The market should hold the low of its current box at 115-04 and then rally to begin a move 116-18.

10 Year Notes: Should hold 110-30 and then rally to 111-26.

Eurocurrency: Support is at 120.70 and I think the market has started a really into the 125-126 range.

September Crude: The next downside target is the 1/2 point of the next box at 54.70.

Gold: Support is at 420 and the market has now started a move to 450.

Google: 280 is support and market should soon reach 327.
 

Friday, July 22, 2005

Eurocurrency


I still think that the September eurocurrency will drop to the 1/2 point of its current box near 120.90 before resuming its rally into the 125-126 zone.
 

Guesstimates on July 22, 8:50 am ET

S&P: The market will hold above 1227 and then move up to 1257 next week.

Bonds: The market should hold the low of its current box at 115-04 and then begin a move 116-24.

10 Year Notes: Should hold 110-30 and then rally to 112-06.

Eurocurrency: I think the market has started a really into the 125-126 range.

Setpember Crude: The next downside target is the 1/2 point of the next box at 54.70.

Gold: Support is at 420 and the market has now started a move to 450.

Google: 285 is support and market should soon reach 327.
 

Thursday, July 21, 2005

More on the Bond Market


Above you will see updated hourly charts for the September T-bonds and 10-year notes.

The bonds dropped a bit below my original 115-04 target and the notes got withink 1/2 a tick of the original 111-00 target.

Some of you may wonder if I regret being early on the long side a couple of days ago and not waiting for these targets to be reached. I often tell people that it is far better to be a little early that a little late when trying to catch a big move like the one I think lies just ahead in the bond market. When you are late it is much harder to take a position, especially if the market doesn't reach your proposed entry level in the first place.

In any case I expect the bonds to hold the bottom of the box at 115-04 and the notes to hold the 1/2 point of the box at 110-30. In a couple of weeks I think we will look back on today's action and see it as a successful test that underlines the market's underlying bullish potential.
 

Gold


Yesterday I told you that I would abandon my 416 gold target if the market showed strength above 423, near the 1/2 division point of the current price box. As you can see from the daily chart of August gold above such strength materialized this morning. I think gold is headed for 450 and eventually above 500 over the next 9 months.
 

Bond and Note Update


Contrary to my expectation expressed earlier this morning both the September T-bond futures and 10 year note futures broke below yesterday's lows. The bonds actually dropped a bit below my original downside target at 115-04. The notes so far got within 4 ticks of the original downside target at 111-00.

I think both markets are on the verge of a big rally and won't go more than a few ticks below these downside targets. These targets are the bottom of the current price boxes for the trend down from the June 27 top.
 

S&P


In this morning's guesstimate I said that the S&P should hold support at the 1/4 point of its box at 1235 but the market blew right past that level heading downward. The chart above shows all the hourly bars (including those recording the overnight Globex trading) since the last London attack which briefly sent the market down to 1167. I now think the S&P will hold support at the bottom of its box at 1224.
 

Eurocurrency


The September eurocurrency futures responded bullishly to the news of the yuan revaluation this morning but again failed to break past the 1/2 point of a box at 122.75. A one box drop here would be normal so I think the market will find support at the 1/2 point of the next lower box at 120.90.

The eurocurrency is in the midst of a move which will take it into the 125-126 zone before the bear market resumes.
 

China Tests the US Bond Market


A couple of hours ago China announced a revaluation of the yuan. This reduces the need for China and Japan to buy US treasury securities in the process of supporting their currencies against the dollar. As such it is bearish news for the US bond market and should lead to higher rates.

This is yet another test of the bond market and comes on the heels of yesterday's Greenspan Test. My views about the markets' prospects haven't changed and I expect this test to be successful too. In fact I think both the notes and the bonds will hold above yesterday's lows. In a few days the bonds should rally up to 117-02 and the notes to 112-12.

My confidence in this analysis is buttressed by Mark Hulbert's observations about the bearish sentiment in the bond market.
 

Guesstimates on July 21, 8:50 am ET

S&P: The market reached the 1/2 point of its box at 1246 this morning on the yuan devaluation news and should hold support at the 1/4 point of that box around 1235. Next move will be to the 3/4 point near 1257.

Bonds: The market is again being tested by the news of the yuan devaluation but I think support at 115-25, the 1/2 point of theshort term 29 tick box will hold and a move up to 117-02 will develop soon.

10 Year Notes: Agin being tested by the yuan news but yesterday's low at 111-09 shoudl hold and I expect to seethe market at 112-12 soon.

Eurocurrency: I think the market has started a really into the 125-126 range.

September Crude: The next downside target is the 1/2 point of the next box at 54.70.

Gold: The market has broken decisively above 423 and has now started a move to 450.

Google: headed up to 327.
 

Wednesday, July 20, 2005

Hulbert's Bond Bears

As you know I am very bullish on the t-bond futures and the 10 year note futures. I expect the bonds to move into the 121-123 range and the notes to move to 116 over the next few months.

Wednesday's price response to Greenspan's testimony was intially bearish but soon thereafter both markets pulled a U-turn and wound up substantially higher on the day. Both markets passed the Greenspan Test with flying colors and this reinforces my bullish convictions.

You might also want to check out this column by Mark Hulbert. He observes that the bond market timers he follows are aggressively bearish. This is music to my ears.
 

Gold


I still think August gold is headed for the bottom of its box at 416. The only thing that would change my mind would be visible strength above 423, the 1/2 point of the current box.

In any case you should remember that I think gold is headed above $500 over the next year or so.
 

Testing the S&P


The stock market got earnings reports from Yahoo and Intel after yesterday's close and then listened to Alan Greespan's testimony this morning.

The intial reaction to all this news was bearish, but as you can see in the hourly chart above the market has just rallied to new highs for the day. Moreover, the S&P futures are holding steady just above the bottom of its current price box at 1224.

Once again, that dog didn't bark. The stock market has been tested by bearish news and refuses to break. This is a very bullish sign.
 

Greenspan Tests the Bond Market


In this morning's testimony before congress Fed chairman Greenspan said that long term bond yields can't go much lower. This is surely bearish news for bond prices. So we will get another chance to see if this dog barks. I expect the market's bearish reaction to Greenspan's prediction to be mild and brief (no more than a day or so on the downside) . If it is then we will have strong evidence that bond prices are headed much higher and longer term interest rates much lower.

The notes have already dropped below yesterday's low at 111-11, contrary to my expectation. My best guess is that the notes will drop no lower than my original target at 111-00 and frankly I don't think the market will go even that low. The hourly chart of the notes above shows some very short term price boxes drawn in blue. I think the notes will soon head up to the top of the second box near 112-11.

I think it is quite likely that the bonds hold above yesterday's low at 115-11. Even if they don't the worst I see on the downside is my orginal target at 115-04. The blue lines on the hourly bond chart show my estimates of very short term price boxes. I think the market will soon rally to the top of its second box near 117-02.
 

Crude Oil


Setember crude oil futures are near the 1/2 point of their current hourly price box and I think the market will soon roll over and begin a drop which will take it to 54.70, the 1/2 point of the next lower box.
 

Guesstimates on July 20, 8:30 am ET

S&P: The market should hold support at the bottom of its current box at 1224 and then rallyto the 1/2 point of the box at 1246.

Bonds: Yesterday's low at 115-11 ended a six week drop and now the market has started a move up intothe 121-123 range.

10 Year Notes: Yesterday's low at 111-11 ended a six week drop and now the notes are headed for 116.

Eurocurrency: I think the market will hold suport at 119.90 and has started a really into the 125-126 range.

September Crude: resistance is the 1/2 point of the current box at 59.50 and the next downside target is the 1/2 point of the next box at 54.70.

Gold: I now think the market will drop to the bottom of its boxe at 416 and then start a big rally.

Google: headed up to 327.
 

Tuesday, July 19, 2005

Bond and Note Update


Earlier this morning I said that these markets should not rally more than 1/2 a box from their morning lows if my downside targets at 115-04 for the bonds and 111-00 for the notes were to be reached. In the event both the bonds and notes have indeed rallied more than half a box as you can see from the updated hourly charts above.

I conclude that the 115-11 low in the bonds and the 111-11 low in the notes ended the drop from the June 3 highs. I think the bonds are now headed into the 121-123 range and the notes to 116.
 

Google


Here is an updated hourly chart of Google. I think GOOG is headed for the 1/2 division point of the next higher box. By the end of the year I expect GOOG to have reached the 376 level.
 

Eurocurrency


It looks to me like the September eurocurrency is headed up from a low at the bottom of its current box. If I am right the market should trade above 121.20 in a day or two. In any case I think the eurocurrency is headed for the 125-126 range before the bear market resumes.
 

IBM


Here is an updated daily chart of IBM showing its price boxes up from the April 20 low at 71.85.

I have been very bullish on this stock as you may recall from my previous posts here, here , here and here.

The bottom of the current price box is 82.70 and I expect IBM to find support there and then move to the top of the box near 88.20.
 

Gold


Here's an updated hourly chart of August gold. You can see that the market tried to rally but couldn't make it past the 1/2 division point of its current box. That told me that a move to the bottom of the box near 416 was imminent.
 

Bonds and Notes


Both the September t-bond futures and 10 year note futures are getting close to my downside targets at 115-04 and 111-00 respectively. This morning's rally is what I like to call "preliminary support". This is usually the rally that occurs just before the final low is made in a downtrend. If I am reading these markets correctly neither will rally more than 1/2 a box from this morning's low before turning down once more.
 

Guesstimates on July 19, 8:40 am ET

S&P: The market should hold support at the bottom of its current box at 1224 and then rally to the 1/2 point of the box at 1246.

Bonds: The downside target of 115-04 is nearby and once the market turns I think it will head up above 120.

10 Year Notes: The notes are drawing closer to the downside target at 111-00 and will soon start a move to 116.

Eurocurrency: I think the market will hold suport at 119.90 and then rally ro at least 125.

September Crude: resistance is the 1/2 point of the current box at 59.50 and the next downside target is the 1/2 point of the next box at 54.70.

Gold: I now think the market will drop to the bottom of its boxe at 416 and then start a big rally.

Google: headed up to 327.
 

Monday, July 18, 2005

Comments

I think I have managed to open up the comments to all, not just registered Blogspot users.

Feel free to offer your views.
 

Big Picture Posts

Here is the index of my "Big Picture" posts. These offer my views of the longer term trends in the markets which interest me.

September 14, 2005
July 18 , 2005
June 26 , 2005
June 14 , 2005
June 8 , 2005
 

The Big Picture

Here are some educated guesses about longer term trends in markets that interest me.

S&P - Headed for 1350 by the end of 2005, then down 20-25% in 2006.

Bonds - up into 120-122 range over the next few months then down to 105 by late 2006.

10 Year Notes - up to 116 over the next few months then down to 104 by late 2006.

3-month Eurodollars - will reach 4.85% by the end of 2006.

Gold - up to 510 before the bull market ends.

Crude Oil - I was looking for the big top in the $60-63 range and I think it has occurred. Down to $ 27 over the next two years.

US Dollar index- up to 100 over the next year and to 121 by 2010

Eurocurrency - Should rally to 125-126 then down to 107 over the next year and to 80 by 2010

Google - up to 376 by the end of 2005

IBM - up to 108 by the end of 2005

Microsoft - up to 42 by the end of 2005

CME - up to 411 by the end of 2005

Sears Holdings - up to 250 by the end of 2005
 

S&P


As you can see in the hourly chart above, the September S&P futures have nestled into the support line defined by the bottom of the market's current hourly price box. The next significant move will be upwards to the 1/2 point of this box at 1246.
 

Crude Oil


Trading activity in crude oil futures will soon switch into the September contract. I've transferred the $4.90 price boxes defined in the August contract over to the hourly chart of the September contract you see above. I've also moved the blue line indicating the 3/4 division point of the $40.40 to $70.40 price box into this chart.

I think September crude will soon move down to the 1/2 division point of the next lower box. This is the same target I have been using for the August contract, so I am guessing that August will move below that level at the same time.

As you know I think crude is in a long term bear market which will move the market under $30 over the next couple of years!
 

Guesstimates on July 18, 8:40 am ET

S&P: The market should hold support at the bottom of its current box at 1224 and then rallyto the 1/2 point of the box at 1246.

Bonds: Resistance is 116-20 and the market will soon drop to the downside target at 115-04.

10 Year Notes: Resistance is 111-28 and the market will soon drop to the downside target at 111-00.

Eurocurrency: I now think the market will drop to suport at 119.90 and then rally to at least 125.

August Crude: resistance is the 1/4 point of the current box at 58.50 and the next downside target is the 1/2 point of the next box at 54.70.

Gold: I think that support at 419 will hold and after that a move above 444 will begin.

Google: headed up to 327.
 

Sunday, July 17, 2005

Bond and Note Boxes


Here are hourly charts of the September t-bond futures and 10 year note futures. I have drawn the hourly boxes which are controlling the downtrend from the lower top made on June 27.

I still think the bonds will make it down to 115-04, the bottom of the current box, and that the notes will drop to 111-00, the 1/2 division point of the next lower box. Once these support levels have been reach I expect both markets to rally above their June highs. The bonds should enter the 121-123 zone and the notes will probably make it into the 115-116 zone.

I don't think sentiment is yet bullish enought to indicate an important top. Take a look at this recent Mark Hulbert column for his view on this. But a rally in the bond futures to 121-123 would put the cash 27 year bond at the lowest yield if the past 40 years. This would probably be a headline news story and the catalyst for excessive bullish sentiment that needs to accompany an important top.
 

Friday, July 15, 2005

S&P


The hourly chart of the S&P futures above shows the 43.70 point boxes which have been controlling the uptrend from the April low at 1136.80 (day session).

The futures recently established a new high for the bull market by breaking above the March '05 top at 1229.80. They stalled at the 1/4 point of the third box at 1235 and have so far reacted to a couple of points below the breakout level. My best guess now is that the market will react to the top of the second box near 1224 and then resume its move up to the 1/2 point of the third box at 1246.
 

Divergences, Divergences


Market technicians like to look for divergences as a signal that a market is about to reverse course. A divergence is a situation in which the market price moves to a higher high (for example) but other indicator of technical strength or weakness (e.g. an oscillator) refuses to "confirm" and instead makes a lower high. Such action is usually interpreted as bearish.

My technician friends tell me that the stock market is showing all kinds of bearish divergences now. For example, they are pointing to the chart of the NYSE advancing issues above and pointing out that the black line which records the daily count of advancing issues failed to confirm the new high in the S&P earlier this week. Of course the only oscillator I care about is the red line, the 10 day moving average of advancing issues, and this did make a new high this past week.

My experience is that divergences are sometimes useful for detecting the end of reactions against the direction of the main trend but they can get you into big trouble by inviting you to fade the main trend prematurely.

The technical types have been fading divergences at temporary highs of this bull market for 16 months now and have been rewarded handsomely for doing so. I think they are about to give back their hard-earned profits because the stock market is about to accelerate to the upside and wipe out the bearish divergences everyone is talking about now.
 

Chicago Merchantile Exchange A


Here is a daily chart of the Chicago Merchantile Exchange stock (CME) traded on the New York Stock Exchange. I have drawn the bull market boxes which were established by the reaction earlier this year from 230.25 down to 163.80. These boxes are 66.45 points high.

The low price since the IPO was 41.14. We are in a bull market so I think CME can easily reach a level 10 times its low or 411.40 by the end of the year.

Meantime CME has broken past the top of its second box at 296.70 and should soon rally to the 1/2 point near 330.
 

Sears Holdings


Here is a daily chart of Sears Holdings (SHLD). I have drawn the bull market boxes which are 23.60 points high.

Sears Holdings lowest price since its public offering was 14.72. This is a bull market so I think a reasonable target for SHLD is 251.80 by the end of the year.

Meantime you can see that the market has bounced off the 1/2 division point of its second box at 161.30 but I think it will hold support at the 1/4 division point of the same box at 155.50. The next big move should be upward to the top of the current box at 173.10.
 

Eurocurrency


As you can see in the hourly chart of the September eurocurrency the market has traded below 120.85 support for 3 hours now and even bounced off that level on an attempted rally. This tells me that the market will drop to the bottom of its current box at 119.90 where the next big rally will start.
 

Guesstimates on July 15, 8:40 am ET

S&P: The market is holding support at the breakout point of 1229 and I don't expect much of a reaction until the market gets to the 1/2 point of the box at 1246.

Bonds: Resistance is 116-20 and the market will soon drop to the downside target at 115-04.

10 Year Notes: Resistance is 111-28 and the market will soon drop to the downside target at 111-00.

Eurocurrency: I think this rally will at least reach 125. Support is 120.90.

August Crude: resistance is the 1/4 point of the current box at 58.50 and the next downside target is the 1/2 point of the next box at 54.70.

Gold: I think that support at 419 will hold and after that a move above 444 will begin.

Google: headed up to 327.
 

Thursday, July 14, 2005

Crude Oil


As you can see in the hourly chart of August crude oil above the market has resumed its downtrend. I think that we will see a brief bounce from 57.20, the bottom of the box but a more substantial rally won't develop until the 1/2 point of the next box below is hit at 54.80 or so.
 

Nasdaq Composite


Here is an updated weekly chart of the Nasdaq Composite index. I last discussed this chart here and here.

I think the index is on the verge of an upside breakout which will eventually carry it to the 1/2 division point of the range of the 2000-2002 bear market. This is the blue line you see near the top of the chart near 3130.
 

Eurocurrency


The hourly chart above shows that the September eurocurrency has held support at 120.86. I think the market is headed to the top of the next box at 123.70 and eventually will move above 125.00 before the bear market resumes.
 

Gold


Here is an hourly chart of August gold showing the short term price boxes. The market has been supported at the 1/2 point of the current box since July 5. I am guessing that gold will have to break 420 by a little, say to 419, in order to flush out the weak longs and set the stage for a strong upmove. The next upswing should carry gold to 450, half a box above the recent top near 444.
 

Bonds and Notes


In this morning's guesstimate I said that the bonds would rally to resistance at 117-08 and then resume their decline. Well I was wrong about that and the market has already resumed its drop with a vengence. The hourly chart above shows the September bonds which are now on the way to the 1/2 point of the current box at 115-26 and ultimately to the bottom of the box at 115-04.
 

Guesstimates on July 14, 8:50 am ET

S&P: Has reached 1234 in Globex trading but I don't think we'll see much of a reaction until the market gets to the 1/2 point of the box at 1246.

Bonds: will trade up to resistance at 117-08 but then drop to the downside target at 115-04.

10 Year Notes: will reach resistance at 112-08 and then drop to the downside target at 111-00.

Eurocurrency: I think this rally will at least reach 125. Support is 120.90.

August Crude: resistance is 60.85 and next downside target is the bottom of the box at 57.20.

Gold: I think that support at 422 will now be broken a bit but expect the market to hold 419. after that a move above 444 will begin.

Google: headed up to 327.
 

Wednesday, July 13, 2005

Predicting the Past

Will Rogers was a famous American humorist, born in 1879 and died in 1935. He was once asked how to make a lot of money in the stock market. He replied:

"Don't gamble; take all your savings and buy some good stock and hold it 'till it goes up, then sell it. If it don't go up, don't buy it. "

I love this quotation because it reminds me of the forecasting methods of astrologers and stock market analysts. They can always explain to you why some disaster happened or why some stock went up or why the stock market bubble collapsed in 2000. They like to predict the past and some of them are even good at it!

Sad to say, a speculator cannot make money predicting the past. He must bet on future events. The future is always murky and very uncertain, and this usually is reflected in the advice you will get from astrologers and stock analysts. They hedge and tell you "maybe this will happen or maybe that will happen".

In this blog I try only to predict the future, not the past. Sure, I make my share of mistakes. But you always know where I stand and this is the only way my views can be of value to you.
 

Eurocurrency


The hourly chart above shows the price boxes for the trend down from the 135.10 top on March 11, 2005. That top occurred in the June contract but we are trading Septembers now; even so, I just move the boxes from one contract to the next with no adjustment for the inter-contract spread.

As you know I think the trend is up from the low at 119.00 and headed for at least 124.00. It is remarkable to me that the boxes from the last trend are still operating well. If it ain't broke I don't fix it so I will continue to use these boxes for the current uptrend too.

The market looks like it is near the end of a full box reaction from 122.87. Buyers should take control near the 1/2 point of the current box near 120.85.
 

S&P Bull Market Boxes


The daily chart you see above shows the bull market boxes in the cash S&P index. These boxes are 186 points high and start at the 768 cash low of October 2002. You can see that the market has been bouncing between the bottom and the 1/2 point of its third box for the past 8 months.

During that time the media have told people to worry about a collapsing dollar, a bubble in real estate, a slowing economy, rising interest rates and a stupid/ malicious president. Yet the market has only gone sideways. That dog didn't bark!

I think a move to the top of the current box near 1320 is imminent.
 

Guesstimates on July 13, 9:00 am ET

S&P: Support now stands at 1220 and the market should reach 1234 this week.

Bonds: Resistance is at 117-08 and downside target is 115-04.

10 Year Notes: resistance is at 112-08 and I am resetting the downside target downside targetto 111-00.

Eurocurrency: I think a rally to 124 has started. Support is 120.90.

August Crude: The market should stall near 60.85 and then head for the next downside target at 54.50.

Gold: I now think that support at 422 will hold and that the market will soon move above 444.

Google: headed up to 327.
 

Tuesday, July 12, 2005

Are They Changing the Lock?


The weekly chart you see above shows fluctuations of the S&P 500 cash index over the past 18 months. Traders have made quite a good living during that time selling every time the average approaches its previous high. These instances are labeled 1 through 5 on the chart. The only loss this tactic would have incurred was on the post-election rally in November 2004.

Now we are at point 6 and sellers have gotten aggressive once more as the market approaches its March high of 1229.11. Are they going to get lucky a sixth time (out of seven) ?

I don't think so! I think the market is changing the lock on the cash box and the sellers will soon be in for a surprise.
 

Google


I have been expecting Google to drop to support near the bottom of its current price box shown in the hourly chart above. But the market has found support at the 1/2 point of this box and is trading sideways. Since I am short term bullish on the S&P I have to conclude that Google is heading up from here, probably into the 327 - 330 zone near the 1/2 point of the next box. I still think GOOG will reach 376 (or higher) by the end of the year.
 

Quick Crude Update


A little while ago I said that the 59.50 level is August Crude should stop the current rally but I was wrong about that as you can see in the updated hourly chart above. Now I think the market will move up to the 3/4 division point (dotted line) of the current box at 60.85 before heading down again. This would make the rally from yesterday's 58.00 low a little more than half a box in extent.
 

Bond Bull Market Boxes


Here is a daily chart of the September T-bond futures in which I have drawn the bull market price boxes. These boxes were defined by the intial, 2 week rally from the 103-02 low on May 14, 2004 in the June 2004 futures. They are 4 points plus 3 ticks high.

The low of the market's current box is 115-11, roughly the level of my current downside target for the reaction from the June 3 top at 119-23. The top of the current box is 119-14. I want to point out that the February 9, 2005 top in the March 2005 futures was 117-12, exactly the 1/2 division point of the current box, while the March 23, 2005 low in the June 2005 futures was 109-00, six ticks lower than 109-06, the 1/2 point of the 107-05 to 111-08 box.

As you know I think this bull market has further to go. The most conservative target is the 1/2 point of the next higher box at 121-15. But I think it more likely that the market rallies all the way to the top of the next box at123-17.
 

Crude Oil


Here is an updated hourly chart of August crude oil with my current estimated price boxes. The market has rallied to the 1/2 point of the current box and should now begin a drop to the downside target which is the 1/2 point of the next box down.
 

Bonds and Notes


Here are the hourly charts (including overnight trading) of the bonds and notes. The short term price boxes are those I have been using for the trend down from the June 27 top. Once the downside targets (see today's guesstimate) are reached I think both markets will rally above their June 3 highs which stand at 119-23 in the bonds and 114-21 in the notes.
 

Guesstimates on July 12, 8:50 am ET

S&P: Support now stands at 1213 and the market should reach 1234 this week.

Bonds: Resistance is at 117-08 and downside target is 115-04.

10 Year Notes: resistance is at 112-08 and downside target is 111-08 to 111-12.

Eurocurrency: I think a rally to 124 has started. Support is 120.90.

August Crude: The bull market is over and next downside target is 54.50. Resistance is at 59.50

Gold: I now think that support at 422 will hold and that the market will soon move above 444.

Google: headed down to support near 275.
 

Monday, July 11, 2005

S&P Boxes


Here is an updated hourly chart of the September S&P futures showing the short term price boxes which are 43.70 points high. I think the market is about to break out above its March high at 1229.80. It should hestitate briefly near the 1/4 point of the next box (1135) and then move up to the 1/2 point at 1246.
 

Crude Oil Boxes


Since I now believe that the long term trend is downward in crude oil I thought I would show you my current estimate of the hourly price boxes in August crude. These are $4.90 high and extend downward from the intraday high at 62.10. My short term downside target is the 1/2 division point of the second box at 54.75.
 

Guesstimates on July 11, 9:10 am ET

S&P: Support now stands at 1207 and the market is heading up to 1234 this week.

Bonds: The 116-16 level should be close to today's low but the upside will be limited to 117-00. I am raising the downside target to 115-16.

10 Year Notes: the 111-20 level should be close to today's low. Resistance above the market is 112-02 and the notes should drop into the target 111-08 to 111-12 zone soon.

Eurocurrency: I think a rally to 124 has started. Support is still 118.90.

August Crude: The bull market is over and next downside target is 54.50.

Gold: I now think that support at 422 will hold and that the market will soon move above 444.

Google: headed down to support near 275.
 

Sunday, July 10, 2005

Why Do We Feel Blue?

My favorite newspaper, the New York Times, has an interesting article in its mutual fund review section today: "The Market's Up. Why Do We Feel Blue?". (You may need a subscription to access this article!)

I think this lede says all that needs be said. There is just no chance that a bull market can end in a situation where a journalist can write a lede like this one.
 

Saturday, July 09, 2005

NYSE Advancing Issues


Take a look at the chart above which shows the daily count of the number of issues on the New York Stock Exchange which advance in price (black line) and the 10 day moving average of this number (red line).

On Friday the number of advancing issues was the highest in six weeks and this number shows an upward zig- zag (higher high following a higher low). Moreover, this upward zig-zag occurred after the advancing issues count and its 10 day moving average refused to confirm the market's new reaction low on Thursday.

All in all, this picture has very bullish implications.
 

It's Done!


On Friday August crude made a try for 62.90, the 3/4 division point of its 40.40 to 70.40 box and my current bull market target. The top of the current short term, 3.00 trading box is at 62.50. I had thought that after Thursday's sharp reversal the market would break past both of these resistance levels by a little bit and then drop sharply but instead August crude only made it up to 61.90 before dropping sharply once more.

I think this is it, the top of the bull market from $10 which began in late 1998. I may be a bit early, but in my experience early is better than late in speculation. Generally, the best time to "take a stand" occurs when the market has had a long advance and has its back against two strong resistance levels as crude has now with the 3/4 division point at 62.90 and the top of the box at 62.50.
 

Friday, July 08, 2005

Bond and Note Boxes


Here are updated hourly charts of the September T-bonds futures and the 10 Year Note futures. They show the boxes for the downtrends in the bonds from the 109-11 lower top on June 27 in the bonds and from the 114-00 lower top in the notes.

I think we have seen the day's high and that both markets will continue their downtrends to my downside targets at about 115-04 in the bonds and 111-12 in the notes.
 

Guesstimates on July 8, 8:50 am ET

S&P: Support now stands at 1193 and the market is heading up above 1230.

Bonds: Resistance is at 117-27 and the bonds are headed for 115-04.

10 Year Notes: the notes are on theirway to 111-12.

Eurocurrency: Support is still 118.90. Next big rally will carry to 124 or so.

August Crude: headed higher to 63.60.The bull market is nearly over.

Gold: look for a break to 416 and then a move above 444.

Google: headed down to support near 275.
 

Did That Dog Bark?

In a previous post I discussed a particular kind of clue which points to the direction of a market's trend : the dog that didn't bark.

Yesterday markets in the US opened to news about the terrorist bombing in London. Normally this should send stocks down and bonds up. The news did just that - for an hour or so. But then the markets reversed direction and ended up where they had closed the previous day (plus or minus a little bit).

This response to the news is evidence that the short term trend is stocks is still upward and in bonds and notes is still downward.
 

Thursday, July 07, 2005

NYSE Advancing Issues


The chart above shows the daily count of the number of issues which advance in price on the New York Stock Exchange (black line) and the 10 day moving average of this number (red line). I commented on this data a few days ago.

Despite the terror news this morning the market held up very well and today's count of advancing issues was higher than yesterday's. It was also higher than the worst day recorded during the drop from the 1225.20 high made on June 17. Notice also that the 10 day moving average turned up a few days ago.

These are all signs of underlying strength and reinforce my conviction that the market is on the verge of a big rally.
 

S&P update

The market rallied well past the 1199 level which at which I had thought it was stalling earlier and this is yet another bullish indication. I don't think we will see 1183 anytime soon. Next stop: 1245.
 

S&P


The hourly chart above for the September S&P futures does not show the overnight move after the terror news which dropped the market briefly to 1167. Nonetheless, I still think that the chart shows the relevant short term price boxes. The subsequent rally stalled at 1199 and I think the market will drop to 1183 or so before resuming its uptrend.
 

IBM


Here is a daily chart of IBM showing the short term price boxes. I think IBM is about to break out of its trading range and begin a march to my 106 target. First stop will be the 1/2 point of the next box around 80.
 

Daily Eurocurrency Boxes


I want to explain a bit more clearly why I am expecting a 500 tick rally in the Eurocurrency.

The daily chart above shows the bear market boxes for the September futures as well as the divisions of the historical range from the 82.45 low in October 2000 to the high at 136.87 last December.

As you can see the market is close to the bottom of its second bear market box at 117.83. It is also close to the 2/3 division point of the historical range at 118.73. The 7/8 point of the bear market box is at 119.02 while the market recently bouced off 118.90, the 1/2 point of its current hourly box.

All in all the September eurocurrency has dropped to strong support and a rally of at least 1/2 a bear market box (476 ticks) is likely now. Such a rally would take the market back to the 3/4 division point which now will act as resistance.
 

Gold


As you can see from the hourly chart above August gold hit the top of its current box at 430 on the terror news and now looks to me like it is headed down to the bottom of its box at 416. I think that gold is headed over 450 once this reaction is complete.
 

Guesstimates on July 7, 8:55 am ET

S&P: The market broke below the bottom of its box at 1180 on the London terror news but I think thatthe early low at 1167 will hold and that the next move will be upward past 1230.

Bonds: I think the 118-30 high reached on the terror news will hold and that the market is nowheaded for 115-04.

10 Year Notes: This morning's high at 113-18 should hold and the notes are on their way to 111-12.

Eurocurrency: Support is still 118.90. Next big rally will carry above 125.

August Crude: Hit 62.00 resistance then broke to support at 57.30 so now is headed higher to 63.60. The bull market is nearly over.

Gold: will probably stall near 430 then break to 416 and then a move above 444.

Google: headed down to support near 275.
 

Wednesday, July 06, 2005

S&P


The September S&P futures closed below what I thought would be support at 1201. Coming after a lower top at 1210 this is bearish action and tells me that the market is headed for the bottom of its current box which stands at 1180. My best guess is that the upcoming low will be a bit higher, probably at 1183 or so. After that I think the S&P's will finally break out above 1230.
 

Guesstimates on July 6, 9:00 am ET

S&P: Support is at 1201 and the next upside target is the 1/2 point of the next box at 1246.

Bonds: Should rally to 117-20 or so then continue the drop to 115-04.

10 Year Notes: Will probably rally to 112-20 then continue the drop to 111-12.

Eurocurrency: Support is still 118.90. Next big rally will carry above 125.

August Crude: headed for 62.00.

Gold: 422 is support and next upside target is 450.

Google: headed down to support near 275.
 

Tuesday, July 05, 2005


Hourly Chart of Google Posted by Picasa
 

Google Price Boxes

Google's 40 point price boxes are getting a bit long in the tooth so this hourly chart shows my latest estimate for the hourly chart price boxes. These are slightly larger, 41.82 points, with the top of the current box at 309.25 and the bottom at 267.43.

I think GOOG will stay in this range for a while but that it is a strong buy anywhere near 270. I still expect GOOG to reach my 376 target later this year and this number may well prove to be too conservative.
 

Hourly Chart of August Crude Oil Posted by Picasa
 

Crude Oil

Here is the box picture for August Crude Oil. I expect the market to reach the top of its current box by rallying into the 62.00 to 62.50 zone. This bull market in crude oil is nearly over and I think the next move of $10 or more from current levels will be downward.
 

Guesstimates on July 5, 8:40 am ET

S&P: 1192.50 will hold and then market should now head up to 1250.

Bonds: look for a rally of about a point from near the 117-00 level followed by a drop to 115-04.

10 Year Notes: look for a half a point rally from 112-08 followed by a drop to 111-12.

Eurocurrency: Support is still 118.90. Next big rally will carry above 125.

August Crude: headed for 62.00.

Gold: Broke support at 429 and so headed for 422.

Google: headed down to support near 275.
 

Monday, July 04, 2005

Eurocurrency


As you know I have been looking for an important low in the eurocurrency ever since the market reached the 122 handle. I am not giving up on this yet! Look for a low near the 1/2 division point of the current box near 118.95. Once the market turns upward by rallying more than 190 points (a full box) it will probably continue upward into the 125-126 range.
 

Hourly Chart of September 10 Year Note Futures Posted by Picasa
 

Hourly Chart of September T-bond Futures Posted by Picasa
 

Bonds and Notes

As you can see from the hourly charts above this post both the bond and the 10 year note futures have accelerated downward from a top lower than the one established on June 3. This tells me that both markets will probably make new lows for the reaction before heading up above their June 3 high points.

I've updated the box estimates in these charts and drawn the boxes for the downtrend which started from 119-11 in the September bonds and from 114-00 in the September 10 year notes.

I think it likely that both markets drop to the bottom of the third box in the trend. This would make the low of the reaction near 115-04 in the bonds and near 111-12 in the notes.
 

Friday, July 01, 2005

Gold


Gold didn't hold 436 support but I think the market will hold support at the bottom of its current box around 429. From there move to 450 will start.
 

Eurocurrency


The hourly chart above show the boxes in the Septeber eurocurrency futures. The 120.60 level did not hold but the market has now dropped to the bottom of a box. I think it is going up from here to 124.00 and probably higher.
 

Guesstimates on July 1, 8:45 am ET

S&P: 1192.50 will hold and then market should now head up to 1250.

Bonds: the market will now drop to 117-00 or so.

10 Year Notes: the notes will soon drop at least to 112-26.

Eurocurrency: Support is still 120.60 and the market is on its way to 124.00.

August Crude: nearthe bottom of the box near 56.50 and should now rally to 62.00.

Gold: 436.50 is the 1/2 point of the box and from there the market should moveup to 449.

Google: headed down to support near 275.