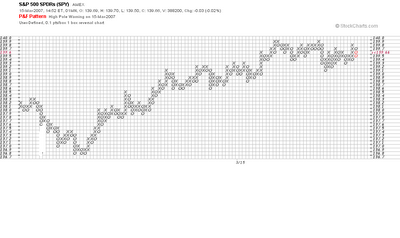
 Here is a 1 box reversal point and figure chart of the Spiders covering the action since yesterday's low. I last commented on this market this morning.
For most of the day the market has traded sideways and in doing so has formed a congestion area bigger than any near the bottom yesterday on on the way up. Since this activity is occurring in the upper region of trading range I discussed this morning I think it fair to conclude that this congestion represents distribution and that a drop back down to 137.50 or so (at least) is in the cards. I wouldn't be surprised to see and upside false breakout first which would carry the market to 140.30 or so but I think a drop of 2 to 3 points is imminent.
2 comments:
Your more recent domed house seem a bit off kilter to the market action. I've noticed that the domed house for dow you presented november of last year have not only timed each wave accurately, but have picked almost the exact top for each move.
http://carlfutia.blogspot.com/2005/06/george-lindsay-posts.html
I think this is perhaps 'the' domed house.
carl,i enjoy reading your forecasting blog.i would like to ask if you can post long term updated chart of the jpy ?!
thanks.
Post a Comment