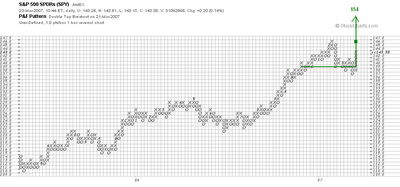

Here is a pair of point and figure charts which gives a longer term look at the Spiders. The first is a three box reversal chart and the second a one box reversal chart. I last commented on this market here.
The most striking thing about the three box reversal chart is that the reaction from the February 22 top near 146 hasn't even begun to slow the pace of the bull market which began from the 2002 lows. This despite the high levels of anxiety and volatility associated with the break. Of equal importance is the fact that the congestion area at the 2002 lows was very wide and so far no congestion area during the bull market has even begun to match the breadth of the base. This too suggests that the bull market will see new highs soon.
The count I have illustrated on the three box reversal chart points to an upside potential of 154 (1540 in the futures).
On the one point chart I have illustrated two counts. The most optimisitic one also counts up to 154, but a count only across the based formed in March counts only to the last high at 146.
Note too that on the one box reversal chart the latest correction looks quite normal when compared to the previous two visible on this chart.
I think both these charts reinforce my view that the bull market which began from the 2002 lows is still alive and that the markets will make new highs in the next month or two.
2 comments:
Hi Carl,
Do you actually trade by using your guesstimate?
thnx
Is it possible that we are at Point #25 on Domed House?
Thanks
Post a Comment