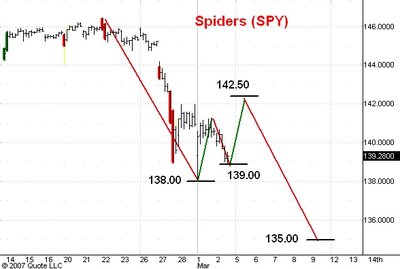

Here are hourly charts of the Spiders and the QQQQ's. The premium of the March futures over cash is nearly zero so the numbers on a chart for the March S&P's are almost exactly 10 times the numbers for the Spiders. I last commented on these markets here.
I think the rally from yesterday's early morning low will be a three phase affair as I have illustrated on these charts. I think the second, downward phase is ending as I write this. Early next week we should see the Spiders rally to 142.50 and the Q's rally to 43.75. From those levels I expect another downleg in the Spiders to about 135 and in the Q's to 39.50.
I still think that new bull market highs lay ahead when the market starts to rally from 135 and from 39.50.
9 comments:
Dear Carl,
I tend to concur with your 3 phase scenario.
Infact on Dec 15th 2006, i had commented the following.
Anonymous said...
Dear Carl,
I am a great admirer of your fantastic work from Bombay, India.
I would like to thank you immensely for all your work since you started this blog and trying to enter the " EDGE" arena.
Sir, your recent comment after the cover of Nov 25th Economist was that the next 100 point move on S&P would be down.
Any opinion whether S&P Cash would go down 100 points from 1437 to 1337 (i.e roughly equal magintude of the fall from MAy highs 1323 to 1223 Lows....)
Also... from the Lows of 1337, rising up again the same distance of previous rise(1437 - 1223 = 214 points) which turns to be 1337 + 214 = 1551 TOP of S&P potential sometime around April-May 2007 ?
Regards
Rhino
12/16/2006 11:55:20 AM
You do not get decent bounces in panic sell offs (realative to local printed EOD lows (and yet you keep predicting "upside before more downside" The value line 4% method cracked today. Don't be too surprised if you see a 10% down day on monday. Your premise in box theory that down markets mimic the double box moves of bull markets ignores the fat tail reality of crashes. Gaussian distribution in a change from low volume to high volume regime--gives you a clue. The rapidly self-reinforcing trend is now DOWN.
Momentum feeds momentum. Carl, we still have a long way to go before the market bottoms.
Pursuitist, you are clearly a short. Shorts such as yourself are praying for this "10%". I keep hearing "10%" sell off. There are so many bears and shorts here, that as a contrarian, things are prime for a good bounce next week. I would watch your short carefully, as this is just a healthy correction in a long term bull market, and not a "crash". Nice "fear" pitch though ; )
respectfully disagree that there will be another leg down on this correction; rather, next week we begin the final push up to the April highs for the year. This has been a big warning but not a beginning---- just as you find auguries in the newspapers I find them in the stars; the total full moon eclipse this weekend, visible from every continent, accompanies a sharp reversal.
Thanks for all you put forth....
Rally into March 12 then crash resumes.
http://www.investorshub.com/boards/read_msg.asp?message_id=17573714
I tried to give this bull market all benefits of doubt, but its proving to me it wants to drop in a big way. (possibly down to SPX 1200)
Carl I think the Dome is complete and has been distorted by the January-March seasonals.
There are three intersting levels suggestive of a top:
a) The sp-100(OEX) retraced exactly .618 from the
2000-2002 bear market.
b) The Amex Institutional Index(XII) retraced .5 from
the same drop.
c) The Russell-3000 came to a hairs breadth to the 2000 top,
forming a double top.
Hi Carl,
Thanks for your great contrary posts! How would you interpret this weekend's barrons cover? they are calling current action as "the passing squall" before the bull is restored. Isnt that bad?
I've been fading your calls the last 2 months and doing very well. How's that for contrarian!!!
Post a Comment