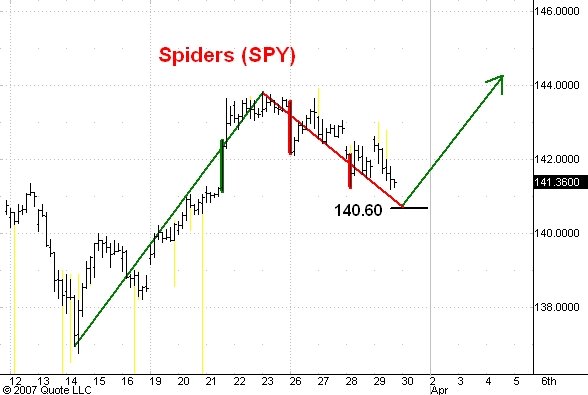
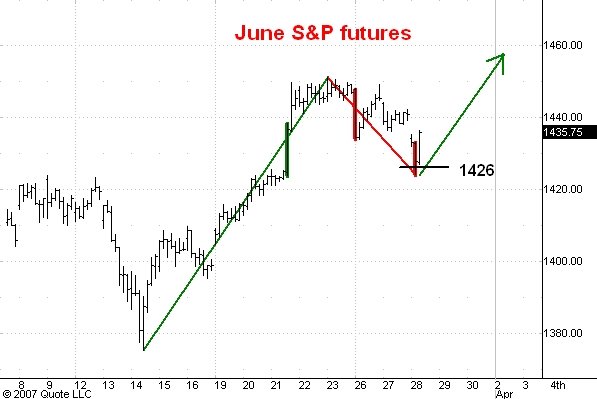
Spiders - June S&P Futures: The very fast late rally yesterday was put in a wide range up bar and this forces me to abandon my forecast of a drop to 140.60 in the Spiders and 1416 in the S&P’s. Instead I think yesterday’s lows will hold and that the market heading up to new bull market highs from here.
QQQQ: I am giving up on my expectation of a further drop to 42.80 and am now looking for a move up to 46.50.
TLT - June Bonds: I now think TLT will drop to 85 before resuming its bull market. The bonds have decisively broken support and are now headed down to 109 before the bull market resumes.
June 10 Year Notes: The notes broke support yesterday and I now think the market is headed for 105-16 before the bull market resumes.
Euro-US Dollar: I think that the next 500 pips from here will be downward.
Dollar-Yen: The 115.14 low on March 5 will hold and that the market is now headed for 123. Meantime the 118.30 level is resistance. I expect to see the yen trade at 130 later this year.
OIH - USO - May Crude: I still think OIH will reach 151-53 before resuming its longer term drop. USO will rallied to 54 yesterday but the next 10 points from here will be downward. May crude has reached resistance at 66.00. I still think the next big move will be downward to 55.00 or so.
GLD - April Gold: I think that both GLD and April gold have begun an extended decline that will carry gold well below 600. Resistance in the futures is still at 665.
May Silver: Silver has resistance today at 1365 and an extended drop lies dead ahead.
Google: I think the 437 low in Google will hold and that the move to 564 has started.
Friday, March 30, 2007
Thursday, March 29, 2007
S&P's, Spiders, and QQQQ's

Here are hourly charts of the Spiders and the QQQQ's. I last commented on these markets here.
Yesterday I thought that we had seen the low of the reaction from last week's high but today the market has today made somewhat lower lows and it looks like the drop isn't yet complete. I expect the Spiders to drop to 140.60, the S&P's to 1416 and the Q's to 42.80. After the low I think these markets will begin a move that will carry them to new highs for the bull market.
Guesstimates on March 29, 8:50 am ET
Spiders - June S&P Futures: The Spiders are headed for the 151-53 range over the next few months. Support today is again at 141.60. The corresponding numbers for the June futures are 1510-30 with support at 1425.
QQQQ: The Q’s are on the way into the 47-48 range. Support stands at 43.54.
TLT - June Bonds: TLT is headed up into the 94-95 range. The bonds have dropped a little below 111-24 but the notes are holding support. For this reason I want to give the bonds a little leeway and am still looking for a rally to 114-24. Over the next few months the bonds are headed for 120.
June 10 Year Notes: The notes made their low on January 26 and are now headed for 111. Short term support is at 108-08 and the next upside target is 109-18.
Euro-US Dollar: I think that the next 500 pips from here will be downward.
Dollar-Yen: The 115.14 low on March 5 will hold and that the market is now headed for 123. Meantime the 118.30 level is resistance. I expect to see the yen trade at 130 later this year.
OIH - USO - May Crude: I think OIH will reach 151-53 before resuming its longer term drop. USO will rally too but only to 52 or so. May crude has resistance today at 66.00. I still think the next big move will be downward to 55.00 or so.
GLD - April Gold: I think that both GLD and April gold have begun an extended decline that will carry gold well below 600. Resistance in the futures is still at 665.
May Silver: Silver has resistance today at 1365 and an extended drop lies dead ahead.
Google: I think the 437 low in Google will hold and that the move to 564 has started.
Wednesday, March 28, 2007
S&P's, Spiders, and QQQQ's


Here are hourly charts of the June S&P futures, the Spiders, and the QQQQ's. I last commented on these markets here.
In this morning's guesstimate I said that support today in the futures was at 1426, the Spiders at 142.60, and the Q's at 43.54. So far these levels have held pretty well and I think that this morning's low was the end of a standard, three phase correction which retraced about a third of the previous rally in these markets. Note that in each of these markets the first and third downward phases of this completed correction ended with wide range down bars. Neither of these two bars saw any follow-through selling. This means that longer time frame traders were buyers on these breaks and indicates a bullish technical condition.
The next upside target in the futures is 1465, in the Spiders 146.50, and in the Q's 45.50. I think these market are on the way to new bull market highs.
Guesstimates on March 28, 8:50 am ET
Spiders - June S&P Futures: The Spiders are headed for the 151-53 range over the next few months. Support today is at 141.60. The corresponding numbers for the June futures are 1510-30 with support at 1426.
QQQQ: The Q’s broke above resistance at 43.70 and this means that the market is on its way into the 47-48 range. Support stands at 43.54.
TLT - June Bonds: TLT is headed up into the 94-95 range. The bonds have dropped a little below 111-24 but the notes are holding support. For this reason I want to give the bonds a little leeway and am still looking for a rally to 114-24. Over the next few months the bonds are headed for 120.
June 10 Year Notes: The notes made their low on January 26 and are now headed for 111. Short term support is at 108-08 and the next upside target is 109-18.
Euro-US Dollar: I think that the next 500 pips from here will be downward.
Dollar-Yen: The 115.14 low on March 5 will hold and that the market is now headed for 123. Meantime the 118.30 level is resistance. I expect to see the yen trade at 130 later this year.
OIH - USO - May Crude: I think OIH will reach 151-53 before resuming its longer term drop. USO will rally too but only to 52 or so. May crude rallied sharply late yesterday on a rumor of fighting in the Persian Gulf. Resistance today is 66.00. I still think the next big move will be downward to 55.00 or so.
GLD - April Gold: I think that both GLD and April gold have begun an extended decline that will carry gold well below 600. Resistance in the futures is still at 665.
May Silver: Silver has resistance today at 1365 and an extended drop lies dead ahead.
Google: I think the 437 low in Google will hold and that the move to 564 has started.
Tuesday, March 27, 2007
Guesstimates on March 27, 8:50 am ET
Spiders - June S&P Futures: The March 14 low at 136.75 will hold and the market is headed for the 151-53 range over the next few months. Support today is again at 142.50. The corresponding numbers for the June futures are 1510-30 with support at 1434.
QQQQ: The Q’s broke above resistance at 43.70 and this means that the market is on its way into the 47-48 range. Support stands at 43.54.
TLT - June Bonds: TLT is headed up into the 94-95 range. The bonds have dropped a little below 111-24 but the notes are holding support. For this reason I want to give the bonds a little leeway and am still looking for a rally to 114-24. Over the next few months the bonds are headed for 120.
June 10 Year Notes: The notes made their low on January 26 and are now headed for 111. Short term support is at 108-08 and the next upside target is 109-18.
Euro-US Dollar: I think that the next 500 pips from here will be downward.
Dollar-Yen: The yen has made three consecutive higher lows over the past three weeks and this has convinced me that the 115.14 low on March 5 will hold and that the market is now headed for 123. Meantime the 118.30 level is resistance. I expect to see the yen trade at 130 later this year.
OIH - USO - May Crude: I think OIH will reach 151-53 before resuming its longer term drop. USO will rally too but only to 52 or so. May crude will rally back to its recent high at 63.75 and then drop to 54.50.
GLD - April Gold: I think that both GLD and April gold have begun an extended decline that will carry gold well below 600. Resistance in the futures is at 665.
May Silver: Silver has begun an extended drop that will carry the market below 1000. The futures have reached 1350 but I think the market will turn lower from here.
Google: I think the 437 low in Google will hold and that the move to 564 has started.
Monday, March 26, 2007
S&P's, Spiders, and QQQQ's


Here are hourly charts of the S&P's, the Spiders, and the QQQQ's. I last commented on these markets here.
The markets dropped this morning after the housing starts number but held above the breakout level in all three cases. This is bullish action. It is empahsized by the fact that the wide range down bar which developed in response to the news was followed by little subsequent selling. This means that longer time frame traders were buying on bad news and this is also a bullish indication.
I think that these breakout levels are now support and that the next significant development will be a move in the futures to 1463, the Spiders to 145.00 and the Q's to 45.60.
New bull market highs will be seen by all three markets during the next couple of months.
Unwary Investors
That's the headline of a New York Times editorial that appeared in Saturday's paper. In this editorial the NYT tells us that in last week's rally ".. investors have been especially heedless of dangers lurking in the economy. Last weeks rally ".. mask[s] a lot of reasons to worry". And finally, "Investors who fail to take a hard look at the vulnerablity of the American economy are courting tremendous risk."
It is unusual for the New York Times to editorialize on the behavior of markets. I commented on its last editorial on the US stock market here. And I noted its last front page story on the stock market here.
Apparently the NYT wants to fight the rally from the March 14 low. I take this as a bullish sign and think it reinforces the case for expecting new bull market highs in the next couple of months.
Guesstimates on March 26, 8:20 am ET
Spiders - June S&P Futures: The March 14 low at 136.75 will hold and the market is headed for the 151-53 range over the next few months. Support today is again at 142.50. The corresponding numbers for the June futures are 1510-30 with support at 1437.
QQQQ: The Q’s broke above resistance at 43.70 and this means that the market is on its way into the 47-48 range.
TLT - June Bonds: TLT is headed up into the 94-95 range. The bonds have dropped a little below 111-24 this morning but the notes are holding support. For this reason I want to give the bonds a little leeway and am still looking for a rally to 114-24. Over the next few months the bonds are headed for 120.
June 10 Year Notes: The notes made their low on January 26 and are now headed for 111. Short term support is at 108-08 and the next upside target is 109-18.
Euro-US Dollar: I think that the next 500 pips from here will be downward.
Dollar-Yen: The yen has made three consecutive higher lows over the past three weeks and this has convinced me that the 115.14 low on March 5 will hold and that the market is now headed for 123. Meantime the 118.30 level is resistance. I expect to see the yen trade at 130 later this year.
OIH - USO - May Crude: I think OIH will reach 151-53 before resuming its longer term drop. USO will rally too but only to 52 or so. May crude will rally back to its recent high at 63.75 and then drop to 54.50.
GLD - April Gold: I think that both GLD and April gold have begun an extended decline that will carry gold well below 600. Resistance in the futures is at 665.
May Silver: Silver has begun an extended drop that will carry the market below 1000. The futures have reached 1350 but I think the market will turn lower from here.
Google: I think the 437 low in Google will hold and that the move to 564 has started.
Friday, March 23, 2007
Spiders and S&P's
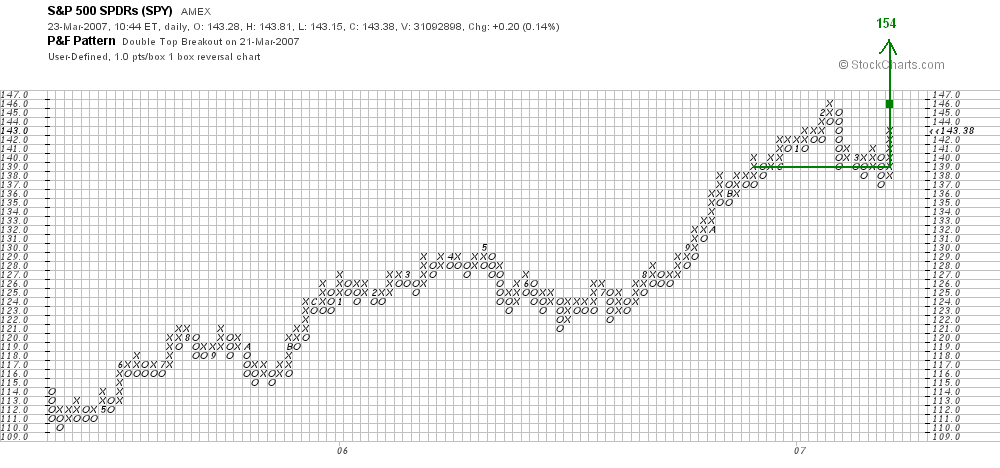
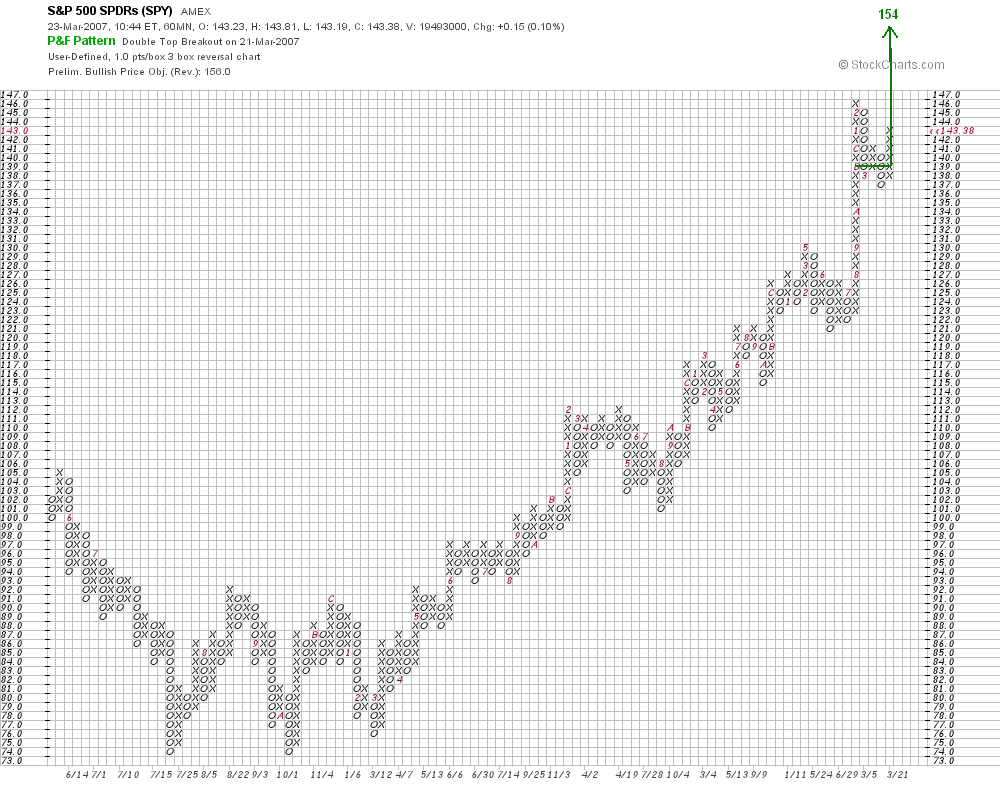
Here is a pair of point and figure charts which gives a longer term look at the Spiders. The first is a three box reversal chart and the second a one box reversal chart. I last commented on this market here.
The most striking thing about the three box reversal chart is that the reaction from the February 22 top near 146 hasn't even begun to slow the pace of the bull market which began from the 2002 lows. This despite the high levels of anxiety and volatility associated with the break. Of equal importance is the fact that the congestion area at the 2002 lows was very wide and so far no congestion area during the bull market has even begun to match the breadth of the base. This too suggests that the bull market will see new highs soon.
The count I have illustrated on the three box reversal chart points to an upside potential of 154 (1540 in the futures).
On the one point chart I have illustrated two counts. The most optimisitic one also counts up to 154, but a count only across the based formed in March counts only to the last high at 146.
Note too that on the one box reversal chart the latest correction looks quite normal when compared to the previous two visible on this chart.
I think both these charts reinforce my view that the bull market which began from the 2002 lows is still alive and that the markets will make new highs in the next month or two.
Oil Service HOLDRS
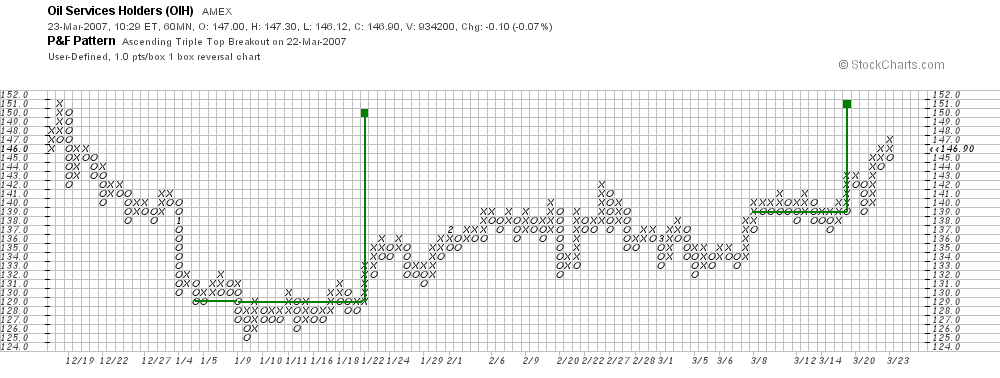
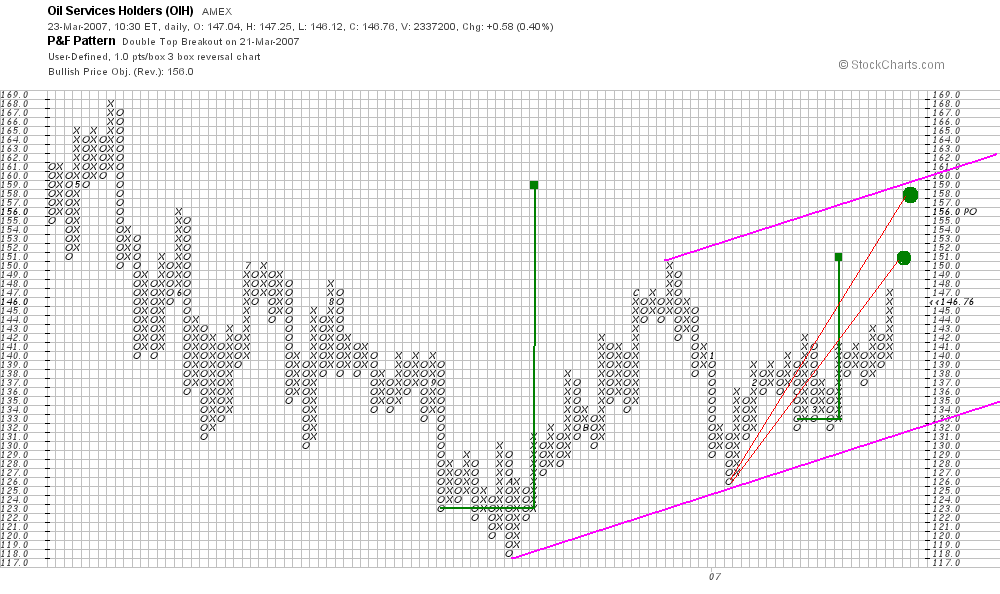 Here are two point and figure charts of the Oil Service HOLDRS. The first is a three box reversal chart while the second is a one box reversal chart. On each the box size is one point. I last commented on this market here.
 I had thought that the congestion area in the 138-40 zone heralded a substantial drop but I was wrong about that. However I still think that OIH will drop below 120 before it goes above 160.
Looking at the point and figure counts on these charts highlights two possible upside targets. The more conservative one is 151 which would equal last December's high. Since I think OIH is in a bear market this is the target with which I am most confortable.
However, there is some evidence that the market will carry OIH higher to 159 or so. There is a 12 column congestion area around last October's low across the 123 price line. Since this is a three box reversal chart this count indicates a potential advance of 3 x 12 or 36 points on top of 123, i.e. and advance to 159. Note also the parallel trend channel I have drawn on the 3 box reversal chart. If the market continues the current pace of its advance it would hit the top of the channel roughly near 159.
Guesstimates on March 23, 9:15 am ET
Spiders - June S&P Futures: The March 14 low at 136.75 will hold and the market is headed for the 151-53 range over the next few months. Support today is again at 142.50. The corresponding numbers for the June futures are 1510-30 with support at 1437.
QQQQ: The Q’s broke above resistance at 43.70 and this means that the market is on its way into the 47-48 range.
TLT - June Bonds: TLT is headed up into the 94-95 range. The bonds should hold the111-24 level and then rally to 114-24. Over the next few months the bonds are headed for 120.
June 10 Year Notes: The notes made their low on January 26 and are now headed for 111. Short term support is at 108-08 and the next upside target is 109-18.
Euro-US Dollar: The Euro nearly reached 134.20 resistance and I think that the next 500 pips from here will be downward.
Dollar-Yen: The yen has made three consecutive higher lows over the past three weeks and this has convinced me that the 115.14 low on March 5 will hold and that the market is now headed for 123. Meantime the 118.30 level is resistance. I expect to see the yen trade at 130 later this year.
OIH - USO - May Crude: I think OIH will reach 151-53 before resuming its longer term drop. USO will rally too but only to 52 or so. May crude will rally back to its recent high at 63.75 and then drop to 54.50.
GLD - April Gold: I think that both GLD and April gold have begun an extended decline that will carry gold well below 600. Resistance in the futures is at 665.
May Silver: Silver has begun an extended drop that will carry the market below 1000. The futures have reached 1350 but I think the market will turn lower from here.
Google: I think the 437 low in Google will hold and that the move to 564 has started.
Thursday, March 22, 2007
Guesstimates on March 22, 8:50 am ET
Spiders - June S&P Futures: The Spiders staged a decisive upside breakout from their two week trading range yesterday. This means that the March 14 low at 136.75 will hold and that the market is headed for the 151-53 range over the next few months. Support should be at the 142.00 breakout level. The corresponding numbers for the June futures are 1510-30 with support at 1430.
QQQQ: The Q’s broke above resistance at 43.70 and this means that the market is on its way into the 47-48 range.
TLT - June Bonds: TLT is headed up into the 94-95 range. The bonds should hold the112-08 level and then rally to 114-24. Over the next few months the bonds are headed for 120.
June 10 Year Notes: The notes made their low on January 26 and are now headed for 111. Short term support is at 108-08 and the next upside target is 109-18.
Euro-US Dollar: The Euro nearly reached 134.20 resistance this morning and I think that the next 500 pips from here will be downward.
Dollar-Yen: My best guess now is that the entire drop from the 122.18 level will carry the market to 114. Meantime the 118.30 level is resistance. I expect to see the yen trade at 130 later this year.
OIH - USO - May Crude: I’ve changed my mind on OIH and now think it will reach 153 before resuming its longer term drop. USO will rally too but only to 52 or so. May crude will rally back to its recent high at 63.75 and then drop to 54.50.
GLD - April Gold: I think that both GLD and April gold have begun an extended decline that will carry gold well below 600. Resistance in the futures is at 665.
May Silver: Silver has begun an extended drop that will carry the market below 1000. The futures have nearly reached 1350 but I think the market will turn lower from here.
Google: Support in Google is at 430. From there a move to 564 will begin.
Wednesday, March 21, 2007
Advancing Issues
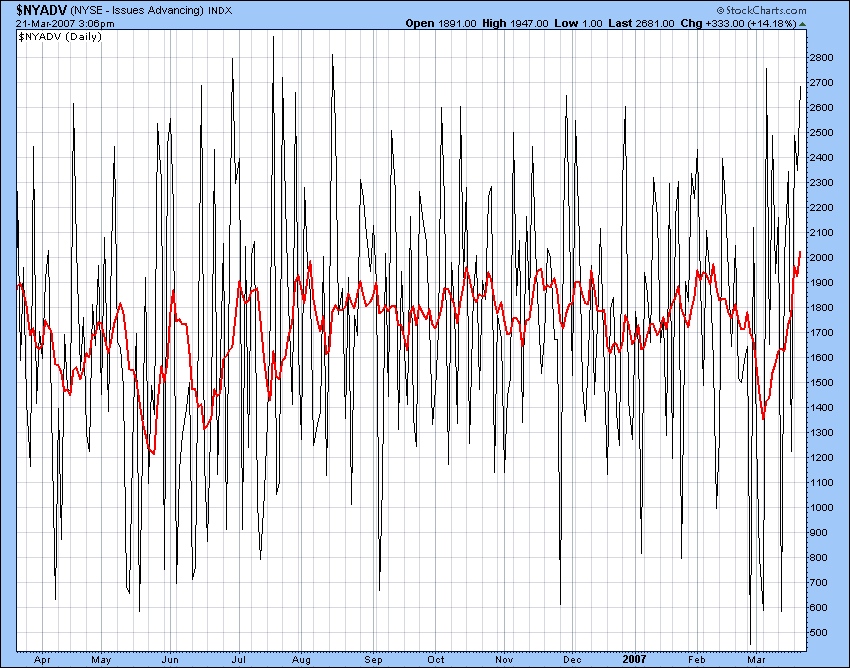
Here is a line chart of the daily count of the number of issues traded on the New York Stock Exchange that advance in price. The chart covers the past 12 months of trading and the red line is the 10 day moving average of the daily number. I last commented on this indicator here.
The most significant thing I see in this chart is that the 10 day moving average today has moved to a level higher than any it has seen in the past 12 months. In particular it is now higher than at any time during the 8 month advance from the June 2006 low point. I think this means that
the market will continue its current advance for at least another month and quite possibly for two.
Of purely historical interest is the fact that at the March 14 low there was a bullish divergence visible between both the daily advancing issues count and its 10 day moving average and the market averages themselves. The advancing issues numbers made higher lows while the market averages made lower lows. I noticed this at the time but didn't think it was significant in the broader context. In any case this divergence can be seen (post hoc) as evidence that the low of a week ago was an important one.
I think the March 14 low will hold and that all the averages will soon be trading at new highs for the bull market which began in 2002.
S&P's and Spiders

Here are hourly charts of the June S&P futures and the Spiders. I last commented on these markets here.
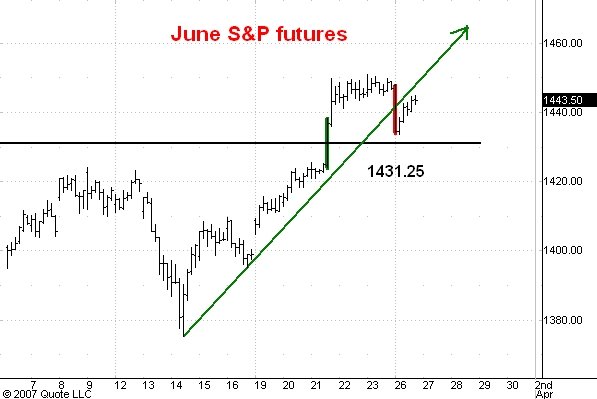
The Fed took no action this afternoon and the markets raced upwards in reponse. I think this is a bullish development because only a strong, underlying technical condition would push the stock market up like this without some obvious postitive development as an excuse.
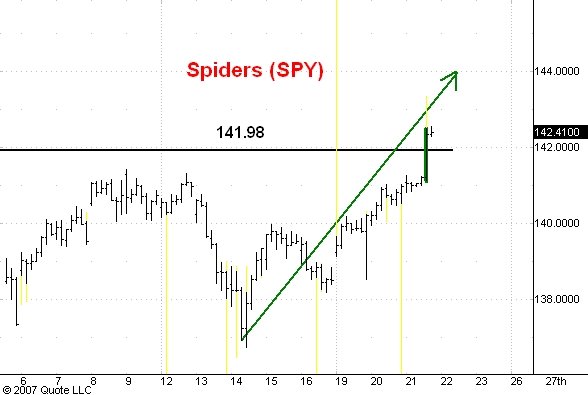
I have have highlighted the previous hour's trading activity in green. It is a wide range up bar which represents a decisive move upward out of the past two week's trading range. I think we shall see a close above the high of this range today and I think this will mean that new bull market highs lie dead ahead.
Guesstimates on March 21, 8:50 am ET
Spiders - June S&P Futures: The Spiders have moved above the 140.50 level but I think the market won’t spend much time above 141.50 before it begins a drop to 135.00. The S&P’s will probably take a peek above 1426 and then begin a drop to 1360.
QQQQ: Resistance in the Q’s is still at 43.70 and I expect this market to soon begin a drop to 41.00.
TLT - June Bonds: TLT is headed up into the 94-95 range. The bonds should hold the112-08 level and then rally to 114-24. Over the next few months the bonds are headed for 120.
June 10 Year Notes: The notes made their low on January 26 and are now headed for 111. Short term support is at 108-08 and the next upside target is 109-18.
Euro-US Dollar: The Euro is headed for 134.20, a new high for the move up from the 116.39 low. However, I think that the next 500 pips from current levels will be down, not up.
Dollar-Yen: My best guess now is that the entire drop from the 122.18 level will carry the market to 114. Meantime the 118.30 level is resistance. I expect to see the yen trade at 130 later this year.
OIH - USO - May Crude: OIH should soon drop to 129-130. USO should drop to 45. May crude is headed down to 54.50.
GLD - April Gold: I think that both GLD and April gold have begun an extended decline that will carry gold well below 600. Resistance in the futures is at 665.
May Silver: Silver has begun an extended drop that will carry the market below 1000. The futures nearly reached 1350 yesterday but I think an extended drop is about to start.
Google: Support in Google is at 430. From there a move to 564 will begin.
Tuesday, March 20, 2007
Spiders and S&P's
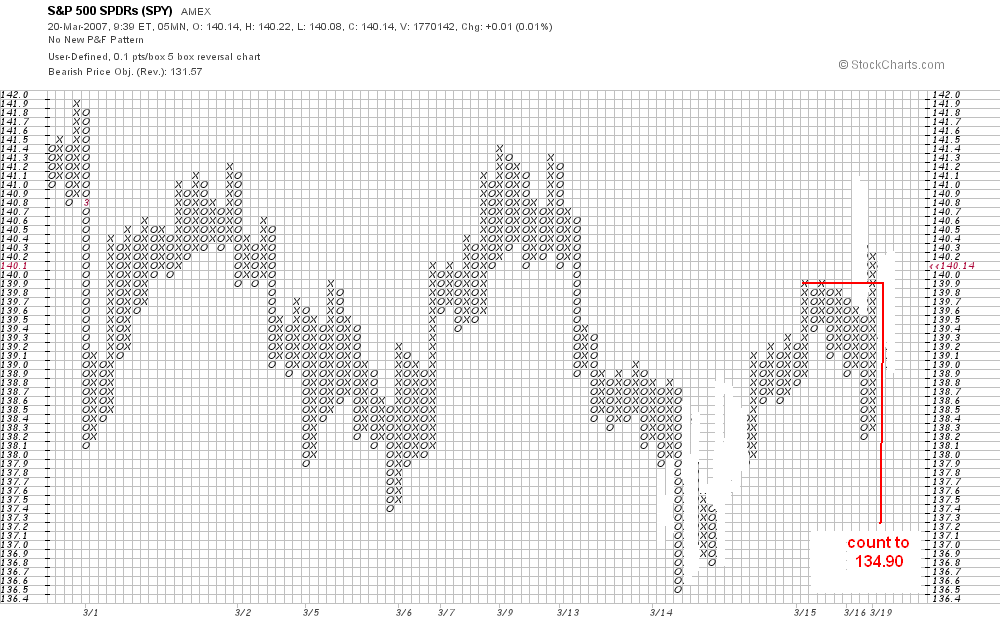
Here is a 5 box reversal point and figure chart for the Spiders. The box size is 0.10 points and I have edited out the effects of bad ticks ( at the expense of some apparent empty columns in the chart). I last commented on this market here.
The think that strikes me about this chart is that the rally from the March 15 low at 136.75 has at the moment run out of steam. There is an obvious congestion area at the top of this rally. If the market turns down from current levels this congestion area will measure 10 columns in width. Since this is a 5 box reversal chart the downside count objective would be 50 boxes (5 points) lower at 134.90, in pretty good agreement with my 135.00 objective for this entire correction.
Note that there was little congestion at the March 15 low and that the congestion over the past couple of days is as big as that at the tops of the previous two rallies. I think this means that the Spiders (and S&P's ) are about to turn lower and move to the 135.00 target (1360 in the S&P's).
Guesstimates on March 20, 8:50 am ET
Spiders - June S&P Futures: I have nearly reached 140.50 resistance and the next swing should carry the market down to 135.00. The S&P’s should stall in the 1415-20 zone and then begin a drop to 1360.
QQQQ: I don’t think the Q’s will make it as far as resistance at 43.70 before they start down to the target for the entire correction at 41.00.
TLT - June Bonds: TLT is headed up into the 94-95 range. The bonds should hold the112-08 level and then rally to 114-24. Over the next few months the bonds are headed for 120.
June 10 Year Notes: The notes made their low on January 26 and are now headed for 111. Short term support is at 108-08 and the next upside target is 109-18.
Euro-US Dollar: The Euro is headed for 134.20, a new high for the move up from the 116.39 low. However, I think that the next 500 pips from current levels will be down, not up.
Dollar-Yen: My best guess now is that the entire drop from the 122.18 level will carry the market to 114. Meantime the 118.30 level is resistance. I expect to see the yen trade at 130 later this year.
OIH - USO - May Crude: OIH should soon drop to 129-130. USO should drop to 45. May crude is headed down to 54.50.
GLD - April Gold: I think that both GLD and April gold have begun an extended decline that will carry gold well below 600. Resistance in the futures is at 665.
May Silver: Silver has begun an extended drop that will carry the market below 1000. Resistance in the futures is at 1336.
Google: Support in Google is at 430. From there a move to 564 will begin.
Monday, March 19, 2007
S&P's, Spiders, and QQQQ's


Here are hourly charts of the June S&P's, the Spiders, and the QQQQ's. I last commented on these markets here.
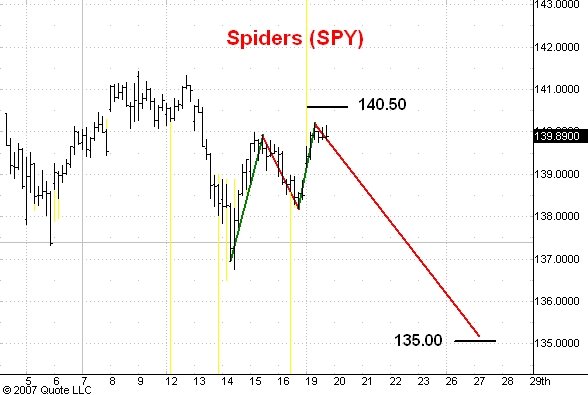
I think the rally phase which began from the March 14 low is just about over even though neither the Spiders nor the Q's managed to reach my upside targets. The next significant move should be a swing down to the ultimate low of the correction which began from the February 22 top. The downside targets are 1360 in the futures, 135.00 in the Spiders, and 41.00 in the Q's.
I don't think the bull market which began from the 2002 low points is over. I expect all three markets to make new bull market highs within the next three months.
Guesstimates on March 19, 8:45 am ET
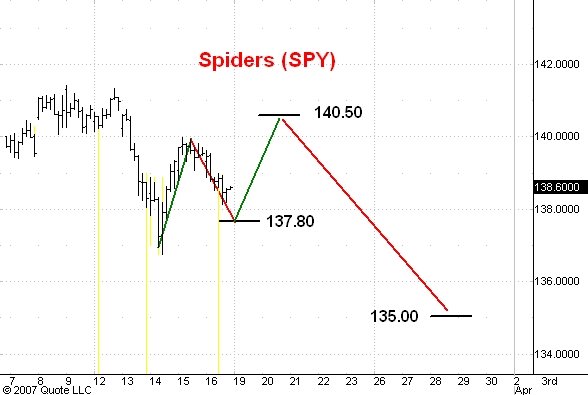
Spiders - June S&P Futures: I still think the Spiders will rally to 140.50. Support is in the 137.80 to 138.30 zone. After the rally I shall expect a move down to 135. The corresponding number for the June futures are 1415, 1392, and 1360.
QQQQ: The market is headed for resistance at 43.70. I have raised the target for the entire correction to 41.00.
TLT - June Bonds: TLT is headed up into the 94-95 range. The bonds should hold the112-08 level and then rally to 114-24. Over the next few months the bonds are headed for 120.
June 10 Year Notes: The notes made their low on January 26 and are now headed for 111. Short term support is at 108-08 and the next upside target is 109-18.
Euro-US Dollar: The Euro is headed for 134.20, a new high for the move up from the 116.39 low. However, I think that the next 500 pips from current levels will be down, not up.
Dollar-Yen: My best guess now is that the entire drop from the 122.18 level will carry the market to 113. Meantime the 118.30 level is resistance. I expect to see the yen trade at 130 later this year.
OIH - USO - April Crude: OIH should soon drop to 129-130. USO should drop to 45. April crude is headed down to 54.50.
GLD - April Gold: I think that both GLD and April gold have begun an extended decline that will carry gold well below 600. Resistance in the futures is at 665.
May Silver: Silver has begun an extended drop that will carry the market below 1000. Resistance in the futures is at 1336.
Google: Support in Google is at 430. From there a move to 564 will begin.
Friday, March 16, 2007
S&P's and Spiders

Here are hourly charts of the June S&P futures and the Spiders. I last commented on these markets here.
This morning the Spiders started trading ex-dividend by about 55 cents. In light of this I want to revise my support calculations at bit and then offer my best estimate of what lies ahead over the next week or so.
The break from today's high in the S&P's should carry a little lower to 1392 or so and be followed by the third phase of the rally that began from Wednesday's low. The upside target for the S&P's is 1415. The Spiders should find support near137.80 and then rally to 140.50.
Once the third phase of this rally is complete I would expect a drop in the S&P's to 1360 and the Spiders to 135.00 which should prove to be the final downleg in the correction which began from the February 22 top.
Guesstimates on March 16, 8:50 am ET
Spiders - June S&P Futures: The Spiders are going to rally back close to the high of their trading range at 141.42 before a move down to 135 begins. Support today is at 138.30. The corresponding levels for the futures are 1424 and 1360 and 1392.
QQQQ: The market is headed for resistance at 43.70. I have raised the target for the entire correction to 41.00.
TLT - June Bonds: TLT is headed up into the 94-95 range. The bonds should hold the112-08 level and then rally to 114-24. Over the next few months the bonds are headed for 120.
June 10 Year Notes: The notes made their low on January 26 and are now headed for 111. Short term support is at 108-08 and the next upside target is 109-18.
Euro-US Dollar: The Euro broke decisively above resistance early this morning so I think it is headed for 134.20, a new high for the move up from the 116.39 low. However, I think that the next 500 pips from current levels will be down, not up.
Dollar-Yen: My best guess now is that the entire drop from the 122.18 level will carry the market to 113. Meantime the 118.30 level is resistance. I expect to see the yen trade at 130 later this year.
OIH - USO - April Crude: OIH should soon drop to 129-130. USO should drop to 45. April crude is headed down to 54.50.
GLD - April Gold: I think that both GLD and April gold have begun an extended decline that will carry gold well below 600. Resistance in the futures is at 665.
May Silver: Silver has begun an extended drop that will carry the market below 1000. Resistance in the futures is at 1336.
Google: Support in Google is at 430. From there a move to 564 will begin.
Thursday, March 15, 2007
Spider Update
 Here is a 1 box reversal point and figure chart of the Spiders covering the action since yesterday's low. I last commented on this market this morning.
For most of the day the market has traded sideways and in doing so has formed a congestion area bigger than any near the bottom yesterday on on the way up. Since this activity is occurring in the upper region of trading range I discussed this morning I think it fair to conclude that this congestion represents distribution and that a drop back down to 137.50 or so (at least) is in the cards. I wouldn't be surprised to see and upside false breakout first which would carry the market to 140.30 or so but I think a drop of 2 to 3 points is imminent.
Spiders and S&P's
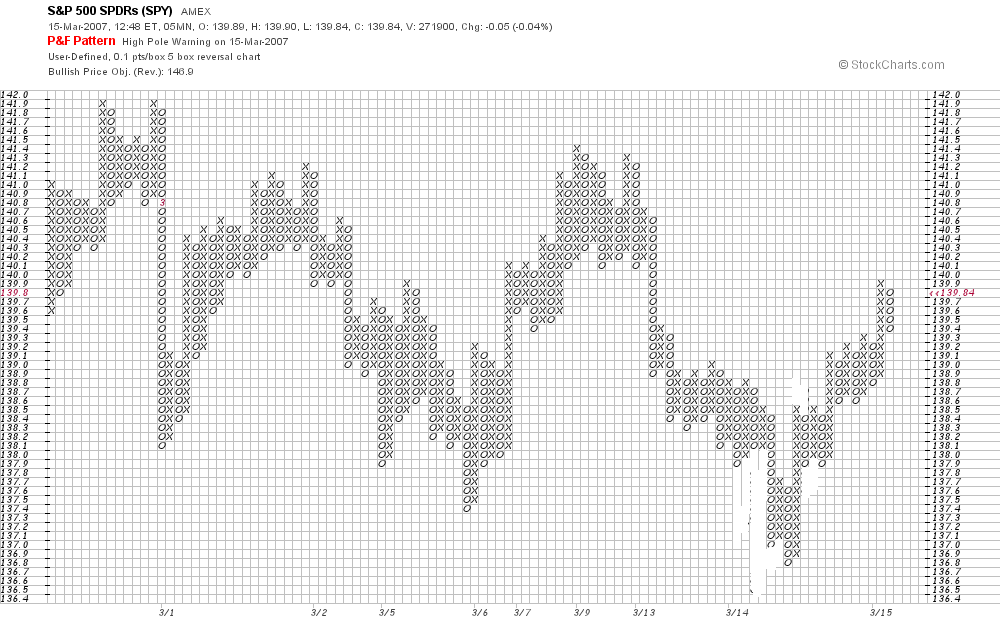
Here is a 5 box reversal chart for the Spiders with a box size of 0.10 points which comes to us courtesy of StockCharts.com. I last commented on this market here.
Unfortunately, Spider data is beset by many "bad ticks" which affect the quality of StockCharts.com 's point and figure charts. On this chart I have edited out the effects of several bad ticks so the action during the past two days will look a little different from that which appears on StockChart's own version of this chart.
You can see that the market is now about in the middle of the trading range which began on March 1. Markets rarely stop a swing in the middle of trading ranges so I expect to see the Spiders trade up to the high near 141.42 over the next couple of days.
I want to bring your attention to the relative sizes of the congestion areas near yesterday's low and near the high at 141.42 which preceeded that low. Note that there was very little congestion (i.e. sideways action) near the low while there was quite a bit of congestion near the preceeding high. This tells me that the market is likely to break below yesterday's low sometime during the next week or two and that is it unlikely that it will even get as high as 141.42 in the interim.
My downside target for the Spiders for the entire correction remains 135.00.
If you trade the S&P's you can multiply the Spider prices by 10 and then add 8 points to get the corresponding prices for the June S&P futures.
Guesstimates on March 15, 8:45 am ET
Spiders - June S&P Futures: Yesterday’s strong close convinced me that the Spiders are going to rally back close to the high of their trading range at 141.42 before a move down to 135 begins. The corresponding levels for the futures are 1424 and 1360.
QQQQ: The market is headed for resistance at 43.70. I have raised the target for the entire correction to 41.00.
TLT - June Bonds: TLT is headed up into the 94-95 range. The bonds should hold the112-08 level and then rally to 114-24. Over the next few months the bonds are headed for 120.
June 10 Year Notes: The notes made their low on January 26 and are now headed for 111. Short term support is at 108-08 and the next upside target is 109-18.
Euro-US Dollar: I think a drop in the euro to below the 125 level is underway. Resistance is at 132.20.
Dollar-Yen: My best guess now is that the entire drop from the 122.18 level will carry the market to 113. Meantime the 118.30 level is resistance. I expect to see the yen trade at 130 in 2007.
OIH - USO - April Crude: OIH should soon drop to 129-130. USO should drop to 45. April crude is headed down to 54.50.
GLD - April Gold: I think that both GLD and April gold have begun an extended decline that will carry gold well below 600. Resistance in the futures is at 665.
May Silver: Silver has begun an extended drop that will carry the market below 1000. Resistance in the futures is at 1336.
Google: Support in Google is at 430. From there a move to 564 will begin.
Wednesday, March 14, 2007
S&P's, Spiders, and QQQQ's


Here are hourly charts of the June S&P futures, the Spiders, and the QQQQ's. I last commented on these markets here.
In this morning's guesstimate I said that a 10-20 point rally would be likely in the S&P from the 1375-80 zone and a 1 - 2 point rally in the Spiders would be likely from the 136.50 - 137.00 zone. So far the rally in both markets has been a little bigger than the upper end of the ranges I cited.
I really can't tell if the next move of 10 to 20 points in the S&P's will be upward from here or instead downward. At the moment I lean slightly toward the view that both market's will drop down close to this morning's low. If this happens I shall have to guess whether the market will continue to its ultimate downside target or instead reverse and head back close to the 1424 high in the futures and the 141.42 high in the Spiders.
However, I am still confident that before the smoke clears and the correction from the late February highs ends we shall see the futures at 1360 and the Spiders at 135.
One interesting development has been the action in the Q's today. Unlike the Spiders and the S&P's the Q's did NOT make new lows for the correction this morning. This is a sign of developing strength in the technology sector and is the first indication that this sector may well lead the market up on its next sustained advance. In any case I am raising my downside target for the correction in the Q's from 39.50 to 41.00.
US Oil Fund
Here is a 1 box reversal chart of the US Oil Fund ETF. I last commented on USO here.
Last year's January - July top in USO was only part of a much bigger top/congestion area centered at the 70 level. Even so, all by itself it projects a low at 35 which would correspond to a price of crude oil in the mid 40's as opposed to 58.00 today. For this and other reasons I think that the bear market in crude oil has not yet ended.
Now look at the price action since the recent low a little above the 42 level. Notice how small was the congestion area near the low and how much bigger is the congestion area near the recent high at 51. Note to that this latter high congestion area is still visibly below the last congestion area on the way down from 74, thus giving further evidence that the longer term trend is downward.
Given the size of the congestion are near 51 it would be resonable to predict and imminent downside breakout below 42 (red count). But corrections in a bear market typically have three phases and so far it looks to me that we have only see the first, upward phase. So for the time beging I am going with the more conservative downside count (shown in green) which calls for a higher low near 45 and then a third phase rally.
Oil Service HOLDRS
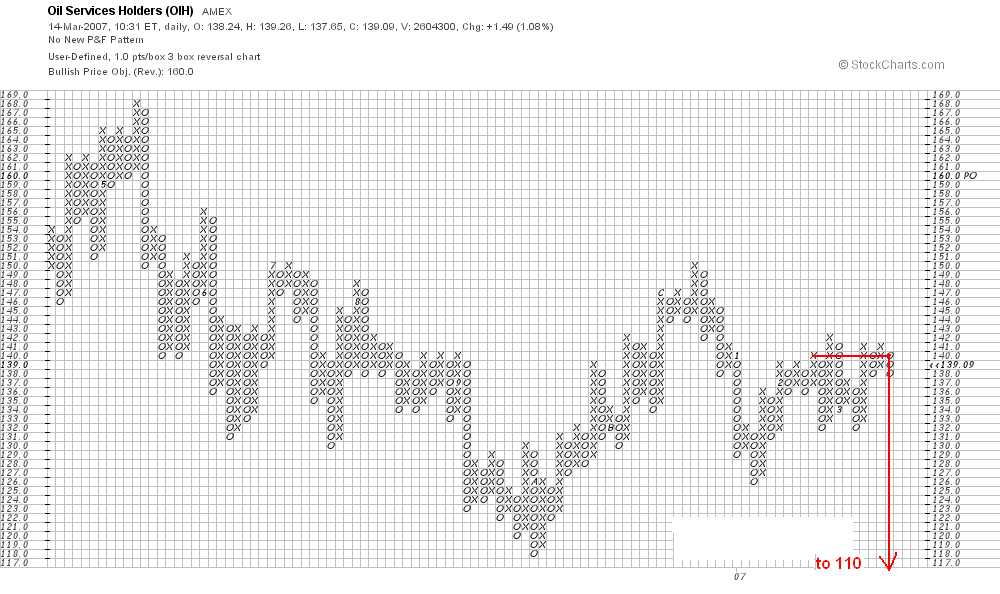
Here is a pair of point and figure charts of the Oil Service HOLDRS etf. I last commented on OIH here.
The first chart is a 3 box reversal chart of OIH going back to its all time high at 169.75. Remember that the data used by StockCharts.com is adjusted for divident payouts so on this chart the recorded high is about a point lower than the actual print high at the time.
On this chart I want to bring your attention to the price action since the October '06 low at 118 and change last year. Near this low you see a congestion area (a period of sideways movement) which extended about 12 columns across the 123 price line. Around the December high at 150 on this chart the corresponding congestion area extende 8 columns across the 145 line, as as such was a smaller congestion area than the one near the 118 low. This is usually evidence that the break from the congestion area near the top will not break below the low congestion area.
On the same chart look now at the action from the January low at 126 to the recent high at 142. Notice how small the congestion area near the 126 low is in comparison to the one near the 142 high. This is a sign of distribution and a warning that the 126 low will be taken out on any break from current levels. There are 10 columns across the 140 line in the higher recent congestion area. Since this is a 3 box reversal chart, we multiply 10 by 3 and expect any drop from here to carry down 30 points from 140, i.e. to 110. The significance of this count is that it calls for a resumption of the bear market.
Now look at the second chart above this post. This is a one box reversal chart. It records in detail the activity since the January low at 126. The congestion area near the recent top is much bigger than the one near the 126 low on this chart and this emphasizes the message of the 3 box reversal chart. The count on the 1 box reversal chart projects a drop to 114.
The 1 box reversal chart contains a bit more information that is important. Note the recent test of the high near 142 resulted in a very narrow range of trading extending 9 columns across the 139 line. This narrow range developed near the high of the 132-142 congestion area and as such indicates distribution. It counts down to the 130 level which indicates an imminent downside break from this congestion area.
All in all these two charts are sending a bearish message. I think OIH is about to begin a move to 110 or lower.
Guesstimates on March 14, 8:50 am ET
Spiders - June S&P Futures: The Spiders are on the way down to 135 over the next couple of weeks. On the way down I expect a brief rally of a point or two to begin from a temporary low in the 136.50-137.00 range. The S&P’s are headed for 1360. There too I expect a brief rally of 10-20 points to begin from the 1375-80 zone.
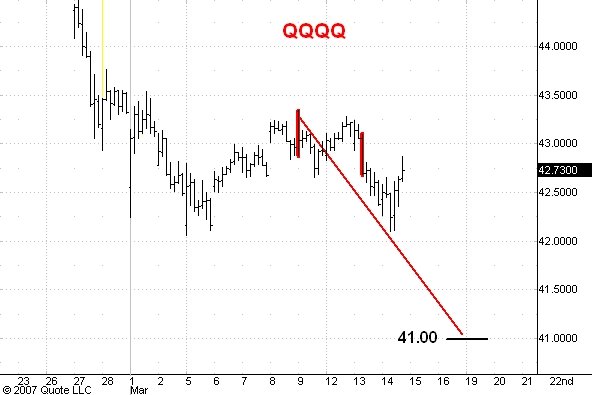
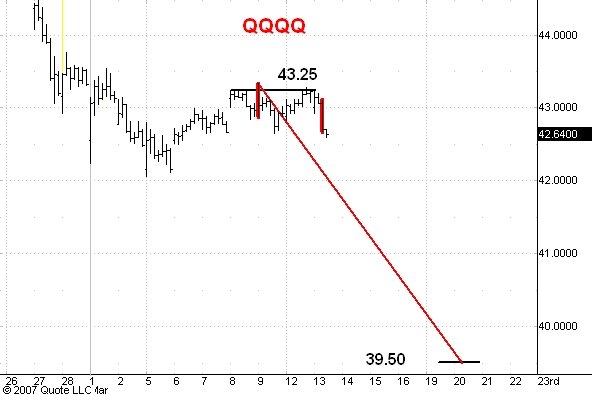
QQQQ: Resistance still stands at 43.70 and a drop to the 39.50 target is underway.
TLT - June Bonds: TLT is headed up into the 94-95 range. The bonds should hold the112-08 level and then rally to 114-24. Over the next few months the bonds are headed for 120.
June 10 Year Notes: The notes made their low on January 26 and are now headed for 111. Short term support is at 108-08 and the next upside target is 109-18.
Euro-US Dollar: I think a drop in the euro to below the 125 level is underway. Resistance is at 132.20.
Dollar-Yen: My best guess now is that the entire drop from the 122.18 level will carry the market to 113. Meantime the 118.30 level is resistance. I expect to see the yen trade at 130 in 2007.
OIH - USO - April Crude: OIH should soon drop to 129-130. USO should drop to 45. April crude is headed down to 54.50.
GLD - April Gold: I think that both GLD and April gold have begun an extended decline that will carry gold well below 600. Resistance today in the futures is at 665.
May Silver: Silver has begun an extended drop that will carry the market below 1000. Resistance today in the futures is at 1336.
Google: Support in Google is at 430. From there a move to 564 will begin.
Tuesday, March 13, 2007
Two year anniversary coming up
The two year anniversary of this blog is coming up at the end of April. Already I've archived more than 2000 posts on various market subjects. You can find a chronological listing of all my posts by clicking on the "topic" links on the right hand side of this blog.
I enjoy telling you what I think is ahead for the markets. And I hope that at least some of you find it helpful and even educational.
If you think my blog has helped you I'd appreciate a vote of confidence from you. I've installed PayPal and Amazon donation links on the right hand side of the blog. Just click on one of them and donate whatever you think appropriate.
Thanks !!!
Added Later: Thanks again to those of you who are choosing to contribute. If you prefer not to donate via PayPal or Amazon you may e-mail me at topos8@aol.com and we can work out some other arrangement.
S&P's, Spiders, and QQQQ's

Here are hourly charts of the June S&P futures, the Spiders, and the QQQQ's. I last commented on these markets here.
I have highlighted in red on each of these charts the last hour of trading. This was a wide range down bar and a downside breakout from a trading range which has developed over the past three days. As such it represents aggressive selling by longer time frame traders which has apparently overwhelmed the buying by short time frame traders I thought I saw yesterday and this morning.
These markets are now headed for their downside targets for this correction: 135 in the Spiders, 1360 in the S&P's, and 39.50 in the Q's.
Spiders
 Here is a longer term point and figure chart of the Spiders. Earlier this morning I posted a couple of shorter term charts on this market.
 The chart above is a 1 box reversal chart with box size equal to 1 Spider point. The chart comes to us courtesty of StockCharts.com which has the best browser based point and figure charting package that I have come across. Sadly, the data used by StockCharts.com is adjusted for dividend payouts and this distorts longer term charts like this one. Longer term trendlines are consequently less reliable as are longer term point and figure counts. However, if one is aware of these problems then one can work around them.
On the chart above I have illustrated the counting method for 1 box reversal charts. The first significant period of sideways action (which the point and figure community calls a "congestion area") developed during the June - August 2006 period around the low points of the May-June 2006 break. Once the market broke out on the upside from this congestion area one could count across the 124 price line and find that the congestion area was 17 squares wide at this point. This projects an upside price target 17 points higher, but remember that this chart is distorted by dividend payouts. On a real time print basis the 124 price line would actually be at 126 and so we should add 17 points to 126 to get an upside target of 143.
This chart gives some information about the likely downside target for the current break from the February 22 top. I have illustrated two downside counts, the first one in red and the second in green. The second one is based on the hypothesis that the market will turn downward from its current levels. Both counts project a low at 134. But I think this is a reaction in a bull market so it would be normal for the market to stop shy of its ideal counting target. My own 135 downside target reflects this consideration.
Spiders and S&P's


Here are two point and figure charts of the Spiders. I last commented on this market here.
The methods of point and figure charting were the very first technical methods I learned. For the past 40 years these kind of charts have been my favorite method of analysis. I think a point and figure chart makes visible critical information which is not generally apparent in a standard bar or candle chart. If I had to choose only one technical method, point and figure charting would be it.
The first chart above this post shows trading in the Spiders since the February 22 top. A single box is 0.10 Spider points high and each column of boxes contains at least 5 boxes. This is known as a 5 box reversal chart based on a box size of 0.10 points.
You can clearly see the three rallies that have stopped in approximately the current price range. Notice that the trading range between 140 and 141 over the past three days covers more columns that any on the way up from the March 5 low. This makes me think that the rally from that low is essentially over.
Across the 141.10 level this recent trading range is 10 columns wide. Since this is a 5 box reversal chart we multiply 10 by 5 and get a potential price target 50 boxes or 5.00 points lower. This is the 136.10 level and shows that we have seen enough distribution to break the Spiders to new lows.
But when I look at the second chart above this post, I begin to suspect that we will see one more rally high before the move down begins. This second chart is a 1 box reversal chart and shows the action during the past four trading days in much more detail. What I find interesting here is that starting late on Friday, March 9 the market has traded a lot in the 140.10 to 140.40 range, the low end of the recent trading range between 140 and 142. This suggests to me that there is some modest accumulation by shorter time frame traders, enought to support a move at least to 141.90 and possibly even a point higher than that.
The thing to remember is that if this rally develops it will be brief and be followed by a move down to 135.
Guesstimates on March 13, 8:30 am ET
Spiders - June S&P Futures: Yesterday afternoon I said that a rally to 1430 in the futures and to 141.90 in the Spiders was likely before the next down leg begins. I still think so but a move below 1405 in the futures and 139.50 in the Spiders will mean that this extended decline has started. The 135 level remains my Spider target and 1360 my S&P target.
QQQQ: Resistance still stands at 43.70 and a drop to the 39.50 target is imminent.
TLT - June Bonds: TLT is headed up into the 94-95 range. The bonds should hold the112-08 level and then rally to 114-24. Over the next few months the bonds are headed for 120.
June 10 Year Notes: The notes made their low on January 26 and are now headed for 111. Short term support is at 108-08 and the next upside target is 109-18.
Euro-US Dollar: I think a drop in the euro to below the 125 level is underway. Resistance is at 132.20.
Dollar-Yen: The yen has been much weaker than I anticipated. My best guess now is that the entire drop from the 122.18 level will carry the market to 113. Meantime the 118.30 level is resistance. I expect to see the yen trade at 130 in 2007.
OIH - USO - April Crude: OIH should soon drop to 129-130. USO should drop to 45. April crude is headed down to 54.50.
GLD - April Gold: I think that both GLD and April gold have begun an extended decline that will carry gold well below 600. Resistance today in the futures is at 665.
May Silver: Silver has begun an extended drop that will carry the market below 1000. Resistance today in the futures is at 1336.
Google: Support in Google is at 430. From there a move to 564 will begin.
Monday, March 12, 2007
S&P's, Spiders, and QQQQ's
I last commented on these markets here.
As I write this the Spiders have just traded at 141.00 and it looks to me like they are headed for 141.90. The futures should reach the 1430 level. The Q's are headed for 43.70.
As I write this the Spiders have just traded at 141.00 and it looks to me like they are headed for 141.90. The futures should reach the 1430 level. The Q's are headed for 43.70.
Guesstimates on March 12, 8:50 am ET
Spiders - June S&P Futures: I think the post-employment number highs Friday marked the end of the rally from the March 5 low but even if I am wrong I see strong resistance at 1430 in the futures and 141.90 in the Spiders. There is as yet no sign that the drop from the February 22 top is complete and the 135 level remains my Spider target and 1360 my S&P target.
QQQQ: Resistance still stands at 43.70 and a drop to the 39.50 target is imminent.
TLT - June Bonds: TLT is headed up into the 94-95 range. The bonds should hold the112-08 level and then rally to 114-24. Over the next few months the bonds are headed for 120.
June 10 Year Notes: The notes made their low on January 26 and are now headed for 111. Short term support is at 108-08 and the next upside target is 109-18.
Euro-US Dollar: I think a drop in the euro to below the 125 level is underway.
Dollar-Yen: The yen has been much weaker than I anticipated. My best guess now is that the entire drop from the 122.18 level will carry the market to 113. Meantime the 118.30 level is resistance. I expect to see the yen trade at 130 in 2007.
OIH - USO - April Crude: OIH should soon drop to 129-130. USO should drop to 45. Resistance in April crude is at 63.30 and from there the market should drop to 55.00.
GLD - April Gold: I think that both GLD and April gold have begun an extended decline that will carry gold well below 600. Resistance today in the futures is at 665.
May Silver: Silver has begun an extended drop that will carry the market below 1000. Resistance today in the futures is at 1336.
Google: Support in Google is at 430. From there a move to 564 will begin.
Friday, March 09, 2007
S&P's, Spiders, and QQQQ's


Here are hourly charts of the June S&P futures, the Spiders, and the QQQQ's. I last commented on these markets here.
In this morning's guesstimate I said that that response to the employment number would carry the futures to 1430 and the Spiders to 142.90. Instead, long time frame sellers came in right after the pit open and the wide range down bar at the open tells me that sustained down move has begun. If I am right then yesterday's high points will prove to be resistance today.
I have changed my minde about the pattern the market is likely to follow over the next 10 days or so. I now think that the rally from Monday's low was the completed second, upward phase of a three phase correction which began from the February 22 high. I think that the third and final, downward phase is now underway. This means that the futures are on the way to 1360, the Spiders to 135.00 and the Q's to 39.50 with the usual rallies to lower tops along the way.
Guesstimates on March 9, 8:50 am ET
Spiders - June S&P Futures: The employment number sent the stock market higher this morning. I still think the next big move will be downward to 136.30 in the Spiders and 1375 in the futures. Meantime the Spiders have resistance today at 141.90 and the futures at 1430. There is as yet no sign that the drop from the February 22 top is complete and the 135 level remains my Spider target.
QQQQ: The market should find resistance today at 43.70 and then begin a drop to 41.00. Downside target for the entire correction is still 39.50.
TLT - June Bonds: TLT is headed up into the 94-95 range. The bonds broke 112-24 support on the employment number today but should hold the112-08 level and then rally to 114-16. Over the next few months the bonds are headed for 120.
June 10 Year Notes: The notes made their low on January 26 and are now headed for 111. Short term support is at 108-08 and the next upside target is 109-18.
Euro-US Dollar: I think a drop in the euro to below the 125 level is underway.
Dollar-Yen: The yen has been much weaker than I anticipated. My best guess now is that the entire drop from the 122.18 level will carry the market to 113. Meantime the 118.30 level is resistance. I expect to see the yen trade at 130 in 2007.
OIH - USO - April Crude: OIH should soon drop to 129-130. USO should drop to 45. Resistance in April crude is at 63.30 and from there the market should drop to 55.00.
GLD - April Gold: I think that both GLD and April gold have begun an extended decline that will carry gold well below 600. Resistance today in the futures is at 665.
May Silver: Silver has begun an extended drop that will carry the market below 1000. Resistance today in the futures is at 1336.
Google: Support in Google is at 430. From there a move to 564 will begin.
Thursday, March 08, 2007
S&P's, Spiders, and QQQQ's
Here are hourly charts of the June S&P futures, the Spiders, and the QQQQ's. I last commented on these markets here.
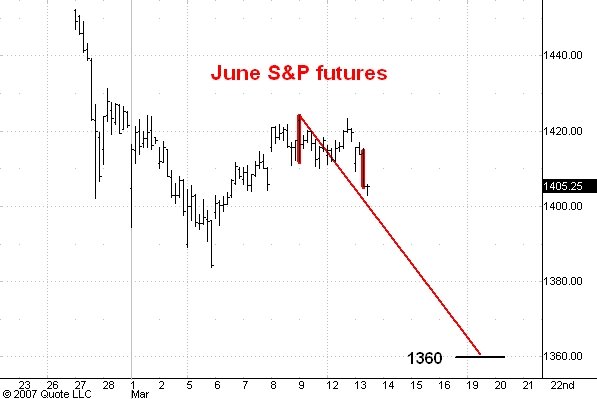
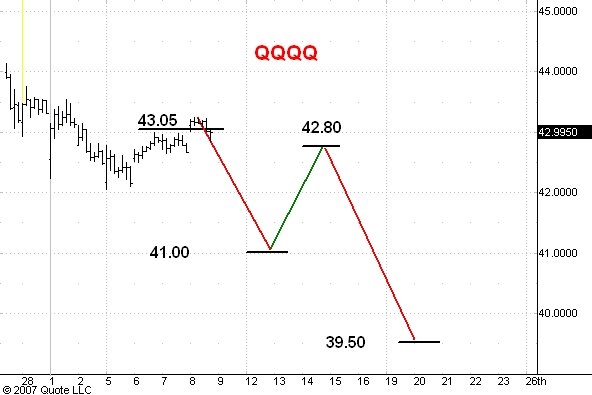
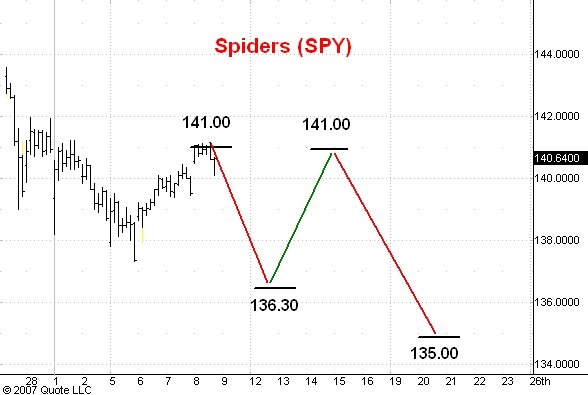
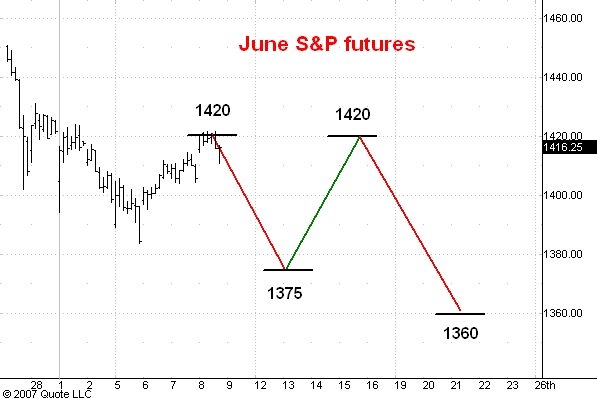
In this morning's guesstimate I said that resistance in the June S&P's would be found at 1420, in the Spiders at 141.00, and in the Q's at 43.05. I think the rally from the March 5 low ended about an hour ago and that all three markets are now headed downward. I think the June S&P's will drop to 1375, the Spiders to 136.30 and the Q's to 41.00 before another, multi-day rally begins.
My ultimate downside targets for the entire correction are 1360 in the June S&P's, 135.00 in the Spiders, and 39.50 in the Q's.
Guesstimates on March 8, 8:50 am ET
Spiders - June S&P Futures: The market rallied overnight after yesterday’s late break. Today the Spiders should find resistance at 141.00 and from there I think the market will drop to 136.30. The June futures become the active contract today. Resistance in June is at 1420 and the market should soon begin a drop to 1375. There is as yet no sign that the drop from the February 22 top is complete and the 135 level remains my Spider target.
QQQQ: The market hit resistance again near 43.05 late yesterday and I think it will soon drop to 41.00 before another rally starts. Downside target for the entire correction is still 39.50.
TLT - June Bonds: TLT is headed up into the 94-95 range. The bonds should hold support near 112-24 and then rally to 114-16. Over the next few months the bonds are headed for 120.
June 10 Year Notes: The notes made their low on January 26 and are now headed for 111. Short term support is at 108-16 and the next upside target is 109-18.
Euro-US Dollar: I think a drop in the euro to below the 125 level is underway.
Dollar-Yen: The yen has been much weaker than I anticipated. My best guess now is that the entire drop from the 122.18 level will carry the market to 113. Meantime the 117.50 level is resistance. I expect to see the yen trade at 130 in 2007.
OIH - USO - April Crude: OIH should soon drop to 129-130. USO should drop to 45. Resistance in April crude is at 63.30 and from there the market should drop to 55.00.
GLD - April Gold: I think that both GLD and April gold have begun an extended decline that will carry gold well below 600.
May Silver: Silver has begun an extended drop that will carry the market below 1000.
Google: Support in Google is at 430. From there a move to 564 will begin.
Wednesday, March 07, 2007
S&P's, Spiders, and QQQQ's
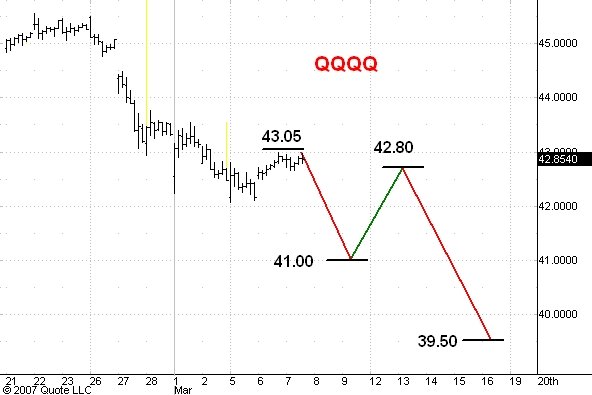
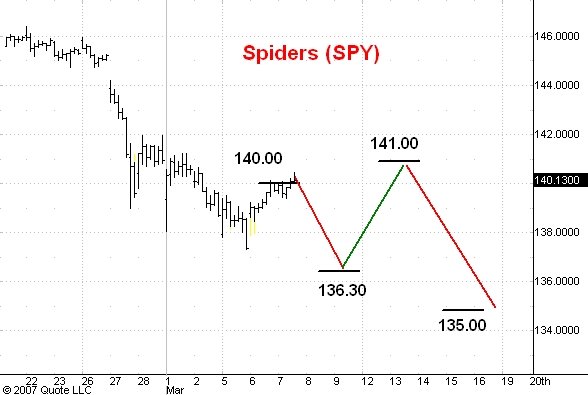
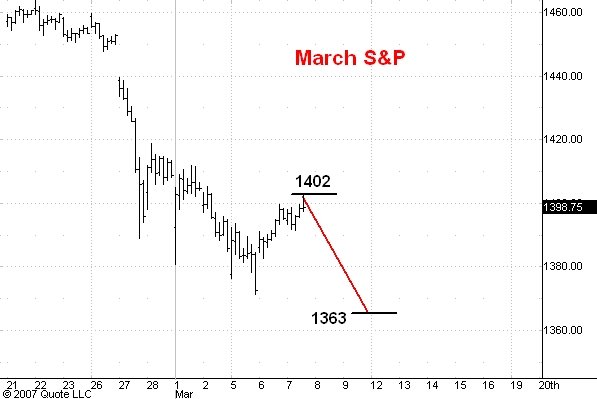
Here are hourly charts of the March S&P futures, the Spiders, and the QQQQ's. Note that the June futures become the most active contract tomorrow morning and trade about 12 points over the March contract. I last commented on these markets here.
I think the rally from yesterday's lows is over and that the market is about to move down to 1363 in the March futures, 136.30 in the Spiders, and to 41.00 in the Q's. After this drop we should see the biggest rally since the February 22 top. After this rally I shall be looking for a third phase decline which will carry the Spiders to 135.00, the June futures to 1360, and the Q's to 39.50.


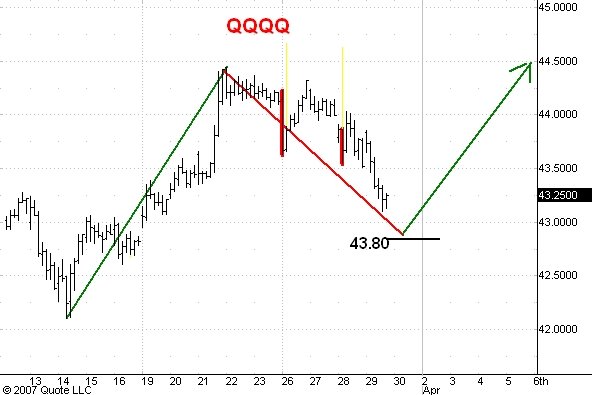
Sears Holdings

Here is a daily chart of Sears Holdings. I last commented on SHLD here.
I think the drop in SHLD has a little further to go. I calculate support at 168. From there I am expecting another rally to 198 or so.
CME and NYX


Here are daily charts of the Chicago Merchantile Exchange and the New York Stock Exchange Group. I last commented on CME here and on NYX here.
CME is acting much stronger than the general market on its rally from the recent low so I am sticking with my 615 upside target. Support for the next reaction is in the 525-30 range.
NYX is not acting as well. Still, I think that it will find support near 76 and resume its move to the slightly revised upside target at 148.
Guesstimates on March 7, 8:50 am ET
Spiders - March S&P Futures: The Spiders hit 140.00 resistance late yesterday and now should drop to 136.30. The S&P resistance is at 1402 and the market should soon drop to 1363. There is as yet no sign that the drop from the February 22 top is complete and the 135 level remains my Spider target.
QQQQ: The market hit resistance near 43.05 late yesterday and I think it will soon drop to 41.00 before another rally starts. Downside target for the entire correction is still 39.50.
TLT - June Bonds: TLT is headed up into the 94-95 range. The bonds should hold support near 112-24 and then rally to 114-16. Over the next few months the bonds are headed for 120.
June 10 Year Notes: SThe notes made their low on January 26 and are now headed for 111. Short term support is at 108-16 and the next upside target is 109-18.
Euro-US Dollar: I think a drop in the euro to below the 125 level is underway.
Dollar-Yen: The yen has been much weaker than I anticipated. My best guess now is that the entire drop from the 122.18 level will carry the market to 113. Meantime the 115.20 level is short term support and a rally from there to 117.50 is likely. I expect to see the yen trade at 130 in 2007.
OIH - USO - April Crude: OIH should soon drop to 129-130. USO should drop to 45. Resistance in April crude is at 63.30 and from there the market should drop to 55.00.
GLD - April Gold: I think that both GLD and April gold have begun an extended decline that will carry gold well below 600.
May Silver: Silver has begun an extended drop that will carry the market below 1000.
Google: Support in Google is at 430. From there a move to 564 will begin.
Tuesday, March 06, 2007
S&P's, Spiders, and QQQQ's
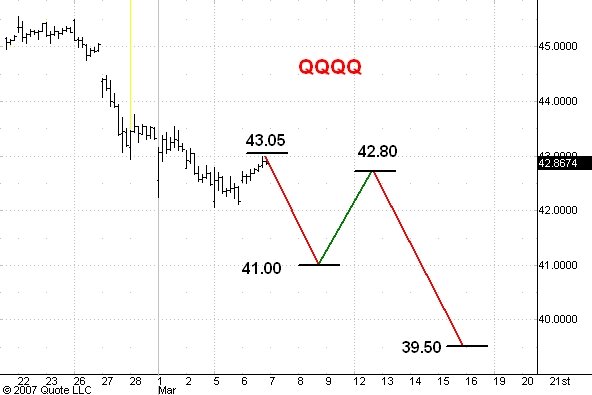

Here are hourly charts of the Spiders and the QQQQ's. The chart for the March S&P looks very similar to the Spider chart if you first multiply the Spider price by 10. I last commented on these markets here.
Today's rally has just about equalled the biggest rally so far during the drop from the February 22 top. I think the next swing will be downward to roughly 136.30 in the Spiders and to 41.00 in the Q's. Then I shall expect the biggest rally of the correction thus far to carry the Spiders up to 141.10 or so and the Q's to 42.80.
After that big rally the third phase of the correction is likely to begin. My downside targets for the end of the correction are 135 in the Spiders and 39.50 in the Q's.
Subscribe to:
Posts (Atom)