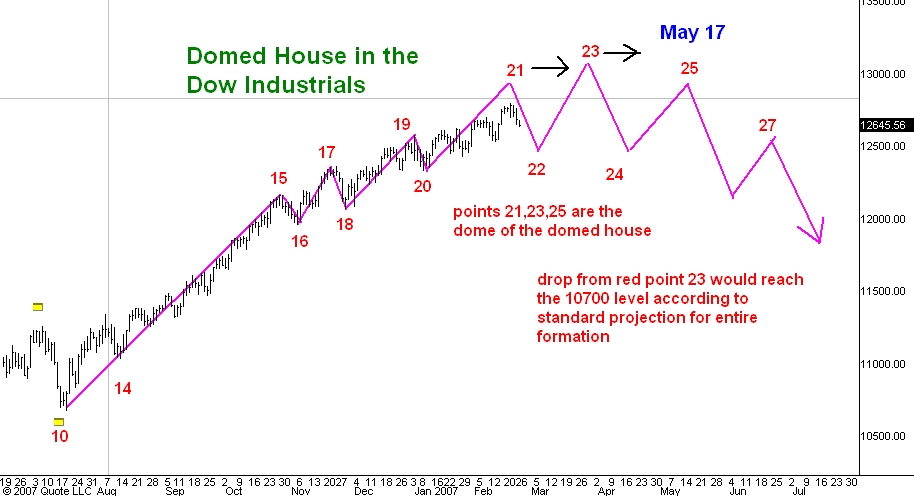
Here is a daily chart showing the development of the Domed House portion of one of George Lindsay's Three Peaks and a Domed House formations. I last commented on this subject here.
As you can see the Dow has progressed upward roughly to the point at which point 21 was designated in my last post. However, I should emphasize that that was only and educated guess. So far I see no reason to regard the top in the Dow a couple of days ago as point 21. The drop from point 21 is typically the biggest reaction on the way up from point 10 and as you can see the drop over the past two days does not yet qualify.
My guess now is that point 21 still lies ahead. I think the Dow will climb to 13000 or a bit higher before point 21 becomes visible. If I am right about this then I think the late March estimate for point 23 will prove to be too early and it may well turn out that point 21 develops then instead of point 23. This would put point 23 off into late April or even as late as May 27.
7 comments:
The semiconductors are trying to release from a multi-month trading range. Do you have any projections for the semiconductors? I would think that a successful breakout would only add further confirmation of further highs for the indices.
To qualify as point 21 going to 22, what is the minimum drop in the dow ?
Need a little help with this part, 21 is typically the biggest reaction on the way up from point 10..."biggest reaction" Thanks Ron
Geez ... I wish Point #23 would get here sooner. I'm not sure how much more clamoring I can take from CNBC for a 10%-plus correction! I guess we'll have to wait for the Dow to hit 13k in order to get them to bring on some more bullish guests. On a more serious note: Carl, have you tried tracing the "3 Peaks and Domed House" pattern on the RUT or MID indexes? I was looking at them the other day and it seemed to me they were more pronounced in fitting the schematic in a "textbook" sense than the Dow has been. Any thoughts there?
If we are at or near point 21, do you still see some of the individual stocks (e.g., Google, NYSE, and others) reaching the heights you were projecting for them not so long ago?
taking all of this in i would like to point something out .
if we join both lindsay and elliot
pts 16 17 18 19 and 20 , should be
similar to a syetrical triangle .
this might mean that point 15 ended
december 20th and point 20 ended
on jan 26th with the dow at 12431.34 . using the 7 months 10 day projection from point 10 on july 18th 2006 we coe up with a guideline for point 23 on feb 28th .the arguement to be made is
point 21 could be over or nearly so right now . and point 22 if memory srves me correct can be a rather sttep decline which forms
the left side of a head and shoulders top . would points 16 through 20 also be considered a
compact top formation from which
we count 104 calandar days for a peak ??? may 10 2007 ???
and lastly what happens if point 20 is broken ??
So, just to follow-up: Are you now thinking that Point #21 will be at the 7 months and 8-10 day mark from Point #14? And, are you using your box theory to establish the target price-range for Point #23? Does George Lindsay talk about this somewhere in his works? I can't seem to find it in the articles I have. Thanks again.
Post a Comment