
Here are daily bar and 15 minute bar charts of Google. I last commented on GOOG here.
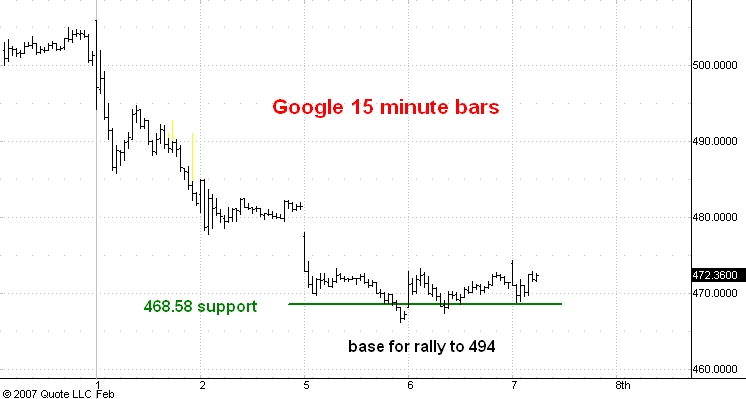
The market reacted more than I had expected but so far is holding support which I later estimated to be in the 465-68 range. The exact level which corresponds to a previous high is 468.58. (See my discussion of chart based support and resistance here. )
The market has traded sideways for a little more than a day now and I think a base which will support a substantial rally is visible. Even if the upcoming rally only matches the length of the last rally it would carry GOOG up to 494. But I expect this market to rally much more than that over the next couple of months. My upside target is still 564 and I suspect even this will prove to be too low.
3 comments:
Dear Carl,
Any update on the NYX? It seems to be in hibernation!
still would like to se 465.37 and subsequent action before long.
print low465.15.. there is nothing left now but to see if price will lead.on another note...HD completed very bearish pattern at yesterday high.
Post a Comment