March S&P Futures: The S&P’s are now headed for 1243 (a bit lower than the 1246 level I cited late yesterday). I think the market will rally from there to 1298.
March Bonds: The bonds re headed for the next upside target at 115-12. Support stands at 113-28. I expect a rally into the 115-116 zone before the bear market resumes.
March 10 Year Notes: Support is at 109-08 and I expect a move to 110-12 as the next development. The notes will move into the 111-112 zone before the bear market resumes.
March Eurocurrency: Wednesday’s sharp rally was decisively reversed later that day so the market now is on its way to 118.20. From there it should move up to 122.30.
February Crude: I now think the market is headed for 62.00 and then to 64.30. I expect crude to trade in a range of $54 to $64 for several months before going much lower.
February Gold: Gold will go to 533 before dropping back below 500. I think that the 544.90 high will hold for at least several weeks.
March Silver: Silver hit 900 but is still making higher lows. I think this means that the rally will continue to 920 before a break below 800 begins. The high at 934.5 (electronic) will hold for at least several weeks.
Google: GOOG will trade between 415 and 435 for a few days. The next upside target is 490.
Friday, December 30, 2005
Thursday, December 29, 2005
S&P

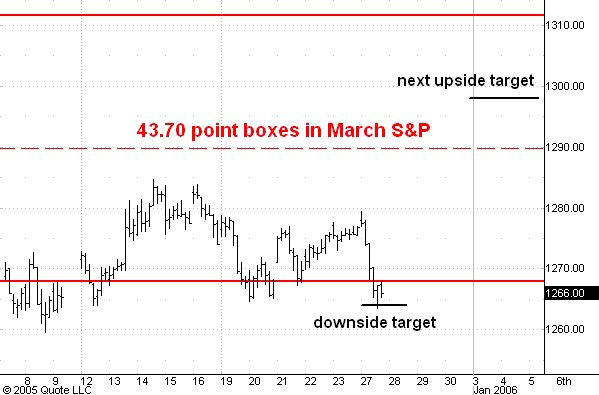
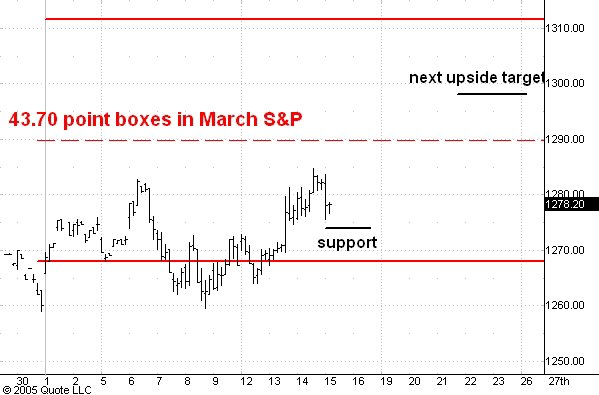
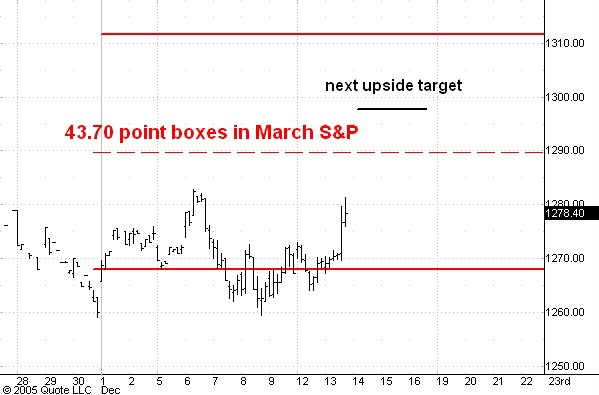
Here is an hourly chart showing pit trading in the March S&P fututures.
The market has held support at 1264 for the past three days but late this afternoon has accelerated below that level. I think this means that the S&P's are headed for the 1/2 point of the next lower box at 1246.
My own view is that we are seeing selling by those who anticipate a January break. However my own guess is that the market will make a low early in January and rally for the rest of that month.
Guesstimates on December 29 , 8:50 am ET
March S&P Futures: 1264 is support and I think the market will rally from there to 1298.
March Bonds: The bonds re headed for the next upside target at 115-12. Support stands at 113-28. I expect a rally into the 115-116 zone before the bear market resumes.
March 10 Year Notes: The notes have reached 109-28 and support is at 109-08. I expect a move to 110-12 as the next development. The notes will move into the 111-112 zone before the bear market resumes.
March Eurocurrency: Wednesday’s sharp rally was decisively reversed later that day so the market now is on its way to 118.20. From there it should move up to 122.30.
February Crude: I now think the market is headed for 62.00 and then to 64.30. I expect crude to trade in a range of $54 to $64 for several months before going much lower.
February Gold: Gold has reached 520 resistance but the market has bounced off that level several times making successively higher lows. So I think we will go to 530 before dropping back below 500. I think that the 544.90 high will hold for at least several weeks.
March Silver: Silver hit 900 but is still making higher lows. I think this means that the rally will continue to 920 before a break below 800 begins. The high at 934.5 (electronic) will hold for at least several weeks.
Google: GOOG will trade between 415 and 435 for a few days. The next upside target is 490.
Wednesday, December 28, 2005
Crude Oil
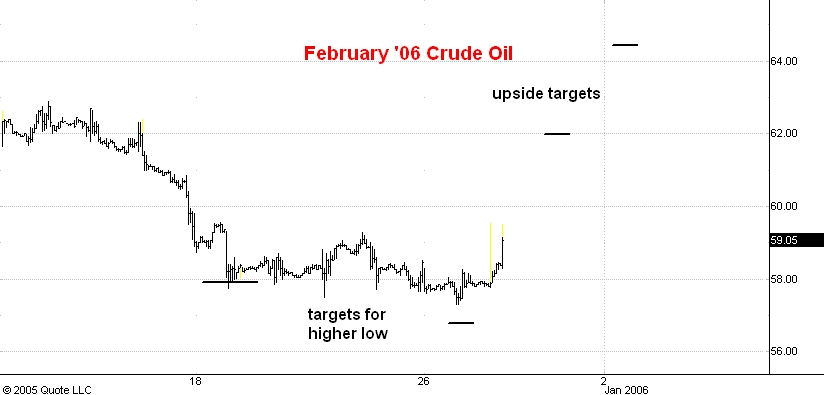
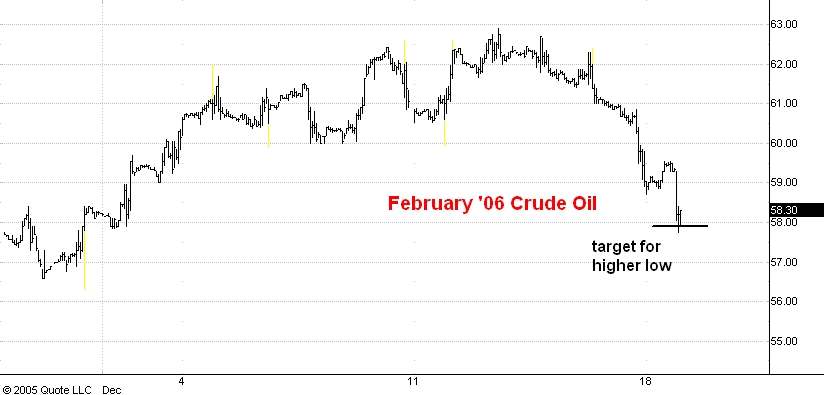
Here is an hourly chart of pit and electronic trading in February '06 crude oil futures.
After the market broke below its first downside target It thought it would continue to its second one. But instead it stopped in between and in early pit trading today you can see that it has rallied strongly.
This tells me that crude is on its way to 62.00 and then to 64.20.
Guesstimates on December 28 , 8:40 am ET
March S&P Futures: 1264 is support and I think the market will rally from there to 1298.
March Bonds: The bonds re headed for the next upside target at 115-12. Support stands at 113-28. I expect a rally into the 115-116 zone before the bear market resumes.
March 10 Year Notes: The notes have reached 109-28 and support is at 109-08. I expect a move to 110-12 as the next development. The notes will move into the 111-112 zone before the bear market resumes.
March Eurocurrency: I now think a rally to 122.30 has begun. The market is eventually headed for 123.50.
February Crude: I think the market is headed for 56.90. I expect crude to trade in a range of $54 to $64 for several months before going much lower.
February Gold: Yesterday I thought the market would react toward the 500 level but it did not so I looks like 520 is the next stop. I think that the 544.90 high will hold for at least several weeks.
March Silver: Silver didn’t bounce much from 880 so is now probably headed for 900. The high at 934.5 (electronic) will hold for at least several weeks.
Google: GOOG will trade between 415 and 435 for a few days. The next upside target is 490.
Tuesday, December 27, 2005
Bonds
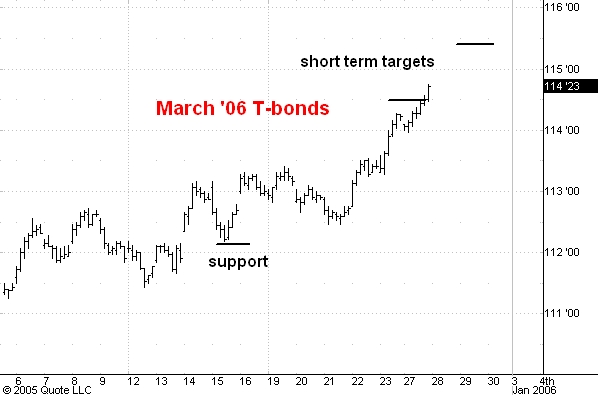
Here is an hourly chart showing pit trading in the March T-bond futures.
My original short term target was 114-16 but the market has moved past this without slowing down so now I think it will reach 115-12 before a reaction can start.
My target for the rally from November's 110-12 low in the December contract was 115-116. The market should enter that zone soon and I think will will start to see signs of an impending top.
S&P
Here is an hourly chart showing pit trading in the March S&P futures.
I think a lot of people expect the market to break early in January and so are selling now.
I also think they will be disappointed.
In any case the market has dropped to support at 1264 and I think the next swing will be upward to 1298.
Guesstimates on December 27 , 8:50 am ET
March S&P Futures: 1264 is support and I think the market is now on its way to 1298.
March Bonds: The bonds have nearly reached resistance at 114-16 and support now is at 113-16. I expect a rally into the 115-116 zone before the bear market resumes.
March 10 Year Notes: The notes should rally to 109-28 and meantime support is at 109-08. I expect this market to move into the 111-112 zone before the bear market resumes.
March Eurocurrency: Short term support is at the 118.20 level and the next upside target is 122.30. The market is eventually headed for 123.50.
February Crude: I now think the market is headed for 56.90. I expect crude to trade in a range of $54 to $64 for several months before going much lower.
February Gold: I now looks like the market made a rally top at 511 but most rallies have two distinct upward phases. So I think we will see a drop to 500 or so and then a second upward phase to 520. I think that the 544.90 high will hold for at least several weeks.
March Silver: Silver has reached 880 resistance and a drop back to 850 now would be normal. A second upward phase will probably carry the market from 850 to 900. The high at 934.5 (electronic) will hold for at least several weeks.
Google: GOOG will trade between 415 and 435 for a few days. The next upside target is 490.
Friday, December 23, 2005
2006 Stock Market Forecast
SUMMARY
The trend in the US stock market averages should be upward during the first 3 months of 2006 and then downward for the following 7 or 8 months. At the 2006 high point the Dow Industrials will probably be trading at 11500 or a little higher, while the S&P 500 index will reach the 1350 level.
The drop from the 2006 high point should be relatively brief and shallow. It will probably last 8 months or so and carry the averages down 20 to 25% from their 2006 highs.
REVIEW OF 2005 FORECAST
Here is the summarizing paragraph from the 2005 forecast:
Let's now summarize the deductions I have drawn from Lindsay's timing methods. First, 2005 should be a generally bullish year. The bull market top could come as early as July 19, 2005 (3P-DH) or as late as January 31, 2006 (15 year 3 month period). My best guess is that in any case the market will trade essentially sideways after July 19, 2005 but that no really bad drop will occur until 2006 begins.
With the exception of the Dow Industrials all the major averages did trend gradually higher over the course of 2005. The 2005 forecast predicted the most dynamic up move for the first half of 2005 but in fact the first half was essentially a flat period for the averages while the second half was a little more bullish.
The 2005 forecast also estimated the likely top in 2005 for the S&P 500:
The subsequent 1974-1976 bull market sent prices up 77%. A comparable advance from the 2002 low of 768 predicts a 2005 top at 1350.
As this is being written the S&P 500 has had its closing high for 2005 so far at 1275.80 on December 14, still a fair distance from 1350.
FORECASTING METHODS
This forecast for stock prices in 2006 is based largely on the techniques of George Lindsay. I will work out some implications of Lindsay’s long time periods, his method of basic advances and declines and finally of the ongoing Three Peaks and a Domed House formation for stock trends during 2006.
LONG TIME PERIODS
According to Lindsay’s theory, bull market tops tend to develop about 15 years and 3 months from previous bear market lows. Bear market lows tend to develop about 12 years and 8 months from previous bull market tops.
In the current situation we want to determine if a bull market top is likely during 2006. An important bear market low occurred in October 1990 prior to the start of the first Gulf war and in the midst of the savings and loan crisis. Counting forward 15 years and 3 months brings us to January 2006. This would lead us to expect an end to the advance from the 2002 lows very soon and then a bear market of some magnitude.
The advance from the October 1990 lows ended temporarily on January 31, 1994. Adding 12 years and 8 months to this date brings us to October 1, 2006 as an approximate time for a bear market low in 2006.
THE 20 YEAR CYCLE
Lindsay also put considerable emphasis on what he believed was a 20 year cycle in stock prices.
Looking back 20 years from 2006 we find that stock prices advanced sharply during the first 3 months of 1986 and then moved sideways the rest of the year. The first 8 months of the following year, 1987, were very bullish.
Looking back 40 years we find a bull market top on February 9, 1966 which was followed by a 25% drop ending on October 10, 1966. The first 9 months of 1967 were very bullish.
Looking back 60 years we find a bull market top on May 29, 1946 which was followed by a 23% drop ending on October 9, 1946. The October 1946 low held throughout the following year but the market was only able to advance about 15% during the first 7 months of 1947.
Looking back 80 years we find a sideways market during 1926 with high points in February and August and lows in March and October. The following year was very bullish.
Looking back 100 years we find a bull market top in January 1906 but a year during which the market moved essentially sideways. Unlike the previous 4 examples above, the following year, 1907, was very bearish.
THE FOUR YEAR CYCLE
There appears to be a very pronounced 4 year cycle in stock prices which has been very evident over the past 60 years. The last low of this cycle was in October 2002 and the next low would then be predicted for October 2006. One can also note that prices have moved upward for more than 2 years subsequent to the October 2002 low. This “right translation” means that the longer term cycles are on average moving upward as well. From this I conclude that the next bear market low will be visibly above the 2002 low.
THE EVIDENCE THUS FAR
Lindsay’s long time periods, the 20 year cycle and the 4 year cycle are all pointing to the same conclusion. There should be a bull market top during the first half of 2006 and probably sometime during the first 3 months of the year. The subsequent low should occur during the last 3 months of 2006 and very probably in October. The drop from the 2005 high should be modest by bear market standards and will probably carry the averages down about 20 to 25% from their 2006 highs.
THE CURRENT BASIC ADVANCE
Lindsay’s most basic timing method was his theory of basic advances and declines. According to Lindsay the bull and bear markets in the stock market averages show surprising consistency in the amount of time they take from start to finish measured in calendar days.
In the current situation my best estimate is that the current basic advance began from the low on March 12, 2003 around 789 in the S&P 500. According to Lindsay’s theory it should be (in his terminology) either a long or an extended advance. The longest extended advance in my records is 996 calendar days. Measured from March 12, 2003 this would predict an end to the basic advance for December 2, 2005.
Of course the S&P 500 has advanced past this last date. This may not prove to be a problem because in Lindsay’s theory the end of every extended basic advance is followed by what he called a “sideways movement”, a period of months during which the averages make little or no net progress. Sideways movements of more than 5 months are generally followed by long bear markets. But Lindsay’s long time periods and the 20 and 4 year cycles are predicting a short bear market. So I conclude that if a sideways movement has begun it should last less than five months and so end by early April, 2006. After the sideways period ends prices will move steadily downward.
THREE PEAKS AND A DOMED HOUSE
The generally sideways market of the past two years has provided at least three or four examples of possible major examples of Lindsay’s Three Peaks and a Domed House formation. I have commented on these on my blog and in previous annual forecasts. Right now I think a major formation is underway in the Dow. The three peaks of this formation occurred in January, March and July of 2005. The separating decline ended in October and the domed house part of the formation began from the October 13, 2005 low. I have identified point 14 of this formation as October 28, 2005 and Lindsay’s rule is to measure forward 7 months and 10 days to arrive at the likely time for the top of the domed house rally. That would be about June 7, 2006.
However, I have presented other evidence above that the bull market top will come before the end of this 7 month and 10 day period. So my best guess now is that the June 7 date will time either the right shoulder of the domed house or the recovery rally immediate after that.
HOW HIGH ?
I have many reasons for thinking the S&P will reach the 1350 level at the 2006 top. The simplest one was cited above in the quotation from the 2005 forecast. A proportional rally in the Dow would carry it to 11500. A subsequent drop of 20% would bring the S&P down to 1080 and the Dow down to 9200.
SUMMARY
The first three months of 2006 should be bullish ones and the S&P 500 should manage to reach the 1350 level during that time. A bear market is then expected to start and should carry the S&P down to a low around 1080 in October 2006.
Guesstimates on December 23 , 8:50 am ET
March S&P Futures: 1264 is support and I think the market is now on its way to 1298.
March Bonds: I think the bonds are on the way to 114-16. I expect the bonds to rally into the 115-116 zone before the bear market resumes.
March 10 Year Notes: The notes should rally to 109-28. I expect this market to move into the 111-112 zone before the bear market resumes.
March Eurocurrency: Short term support is at the 118.20 level and the next upside target is 122.30. The market is eventually headed for 123.50.
February Crude: I now think the market is headed for 56.90. I expect crude to trade in a range of $54 to $64 for several months before going much lower.
February Gold: Market should rally to 522.. Meantime 498 is support. I think that the 544.90 high will hold for at least several weeks.
March Silver: Silver will rally to 880 and meanwhile 845 is support. The high at 934.5 (electronic) will hold for at least several weeks.
Google: GOOG will trade between 415 and 435 for a few days. The next upside target is 490.
Thursday, December 22, 2005
US Dollar
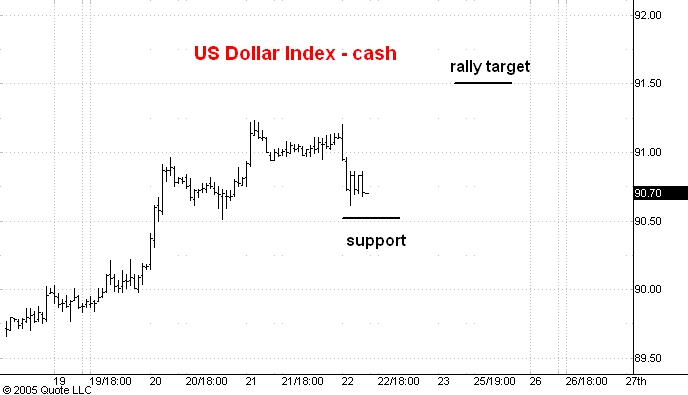
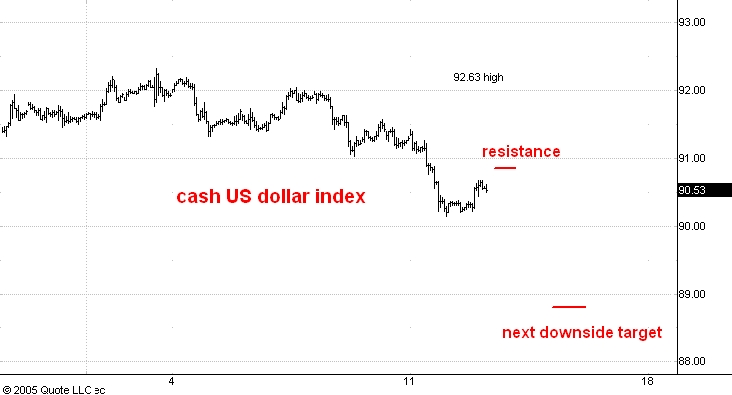
Here is an hourly chart of the cash US Dollar index.
I think the 90.50 level is support and that the market will soon rally to 91.50. After that I expect a drop to 88.50.
Eurocurrency

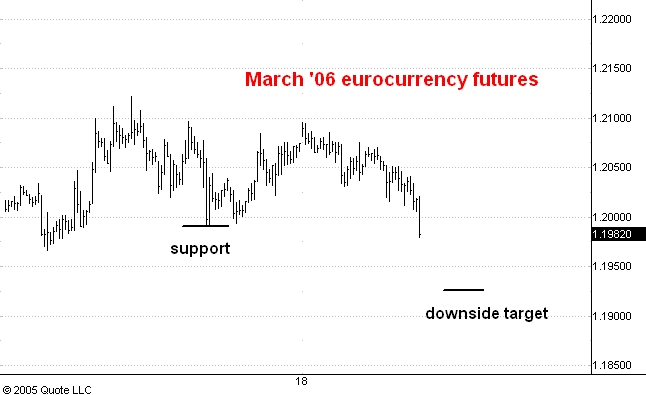
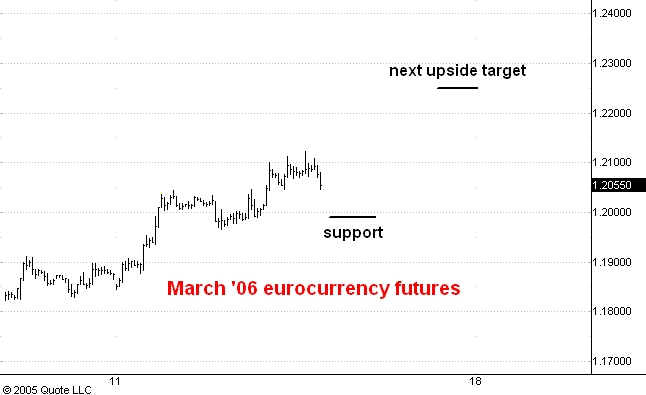
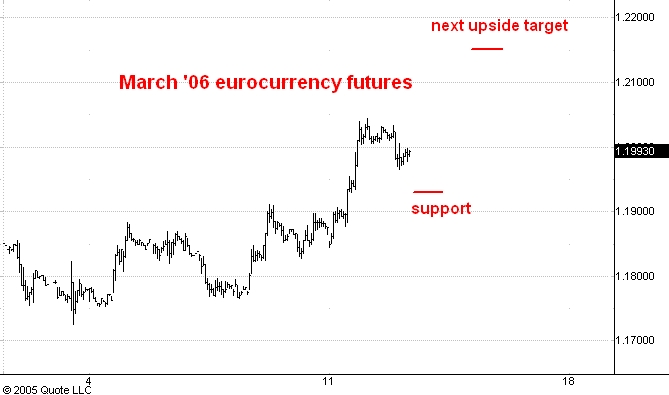
Here is an hourly chart of the March '06 eurocurrency futures.
I think the 119.50 level is resistance and that the market will now drop to my downside target at 118.20. After that I am looking for a big rally to 123.
Silver

Here is an hourly chart of March '06 silver futures showing pit and electronic trading.
I had thought that silver would drop to 825 before starting a strong rally but in the event it only made it to 829. I think this market is now on its way to 880 from which point a break below 800 will begin.
Gold
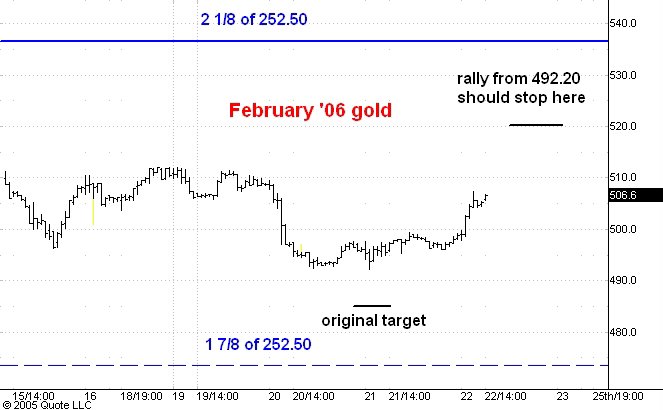
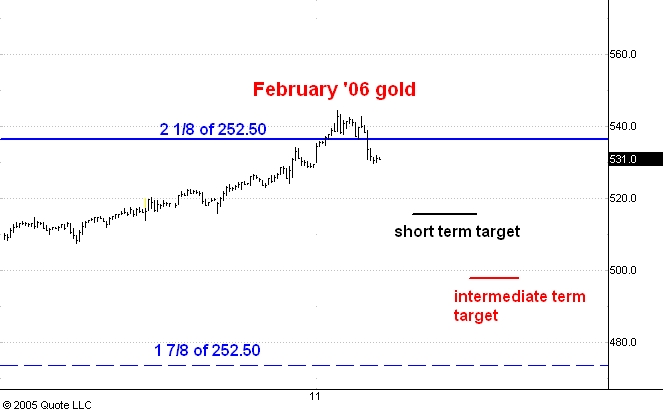
Here is an hourly chart showing pit and electronic trading in February '06 gold futures.
I had thought that the market would make it down to 485 or so before starting a substantial rally but gold only made it down to 492.20. At the moment I expect the market to rally to 520 before a drop below 490 starts.
Guesstimates on December 22 , 8:40 am ET
March S&P Futures: 1264 is support and I think the market is now on its way to 1298.
March Bonds: I think the bonds are on the way to 114-16. I expect the bonds to rally into the 115-116 zone before the bear market resumes.
March 10 Year Notes: The notes should rally to 109-28. I expect this market to move into the 111-112 zone before the bear market resumes.
March Eurocurrency: Short term support is at the 118.20 level and the next upside target is 122.30. The market is eventually headed for 123.50.
February Crude: I think the market will hold 57.80 and then rally to 64.00. I expect crude to trade in a range of $54 to $64 for several months before going much lower.
February Gold: Market should drop to 485. Meantime 500 is resistance. I think that the 544.90 high will hold for at least several weeks.
March Silver: Silver will drop to 825 and meanwhile 850 is resistance. The high at 934.5 (electronic) will hold for at least several weeks.
Google: GOOG will trade between 415 and 435 for a few days. The next upside target is 490.
Wednesday, December 21, 2005
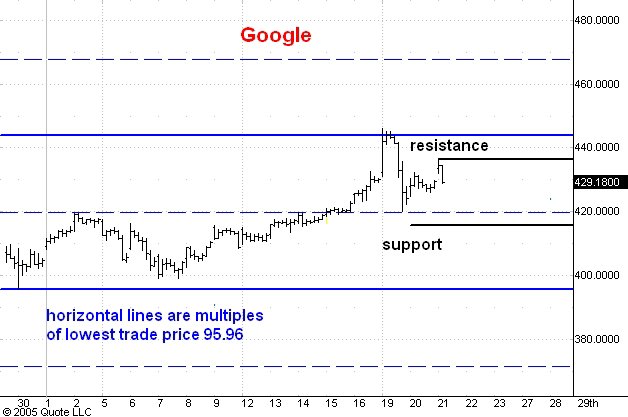
Here is an hourly chart of Google.
I think GOOG has bounced off of the 435 resistance level and is headed for support at 415.
US Dollar
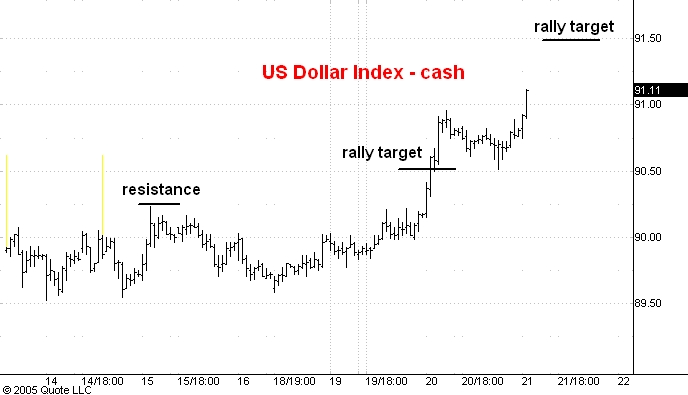
Here is an hourly chart of the cash US Dollar index.
Yesterday I thought that the market would halt at 90.50 but it blew right through that level. Today it looks like resistance will be 100 points higher at 91.50 or so. From there I think a drop to 88.50 will begin.
Eurocurrency
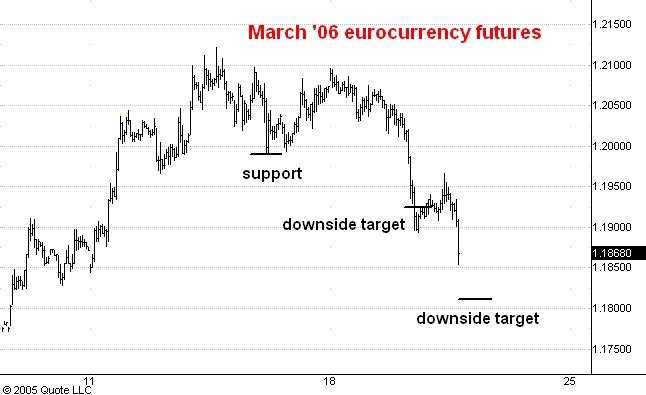
Here is an hourly chart showing pit and electronic trading in the March '06 eurocurrency futures.
Yesterday I said that the market would halt its break at 119.20 but all that developed was a 12 hour trading range centered at that level. This morning the market has accelerated below yesterday's low so I now think we will see that 118.10 level before the market can turn upward again. I am still expecting a low above the 117.20 low in November and a rally above last week's 121.20 high before the bear market resumes.
Guesstimates on December 21 , 8:50 am ET
March S&P Futures: 1264 is support and I think the market is now on its way to 1298.
March Bonds: I think the bonds are on the way to 113-28. I expect the bonds to rally into the 115-116 zone before the bear market resumes.
March 10 Year Notes: The notes should rally to 109-28. I expect this market to move into the 111-112 zone before the bear market resumes.
March Eurocurrency: Short term support is at the 119.00 level and the next upside target is 122.30. The market is eventually headed for 123.50.
February Crude: I think the market will hold 57.80 and then rally to 64.00. I expect crude to trade in a range of $54 to $64 for several months before going much lower.
February Gold: Market should drop to 485. Meantime 500 is resistance. I think that the 544.90 high will hold for at least several weeks.
March Silver: Silver will drop to 825 and meanwhile 850 is resistance. The high at 934.5 (electronic) will hold for at least several weeks.
Google: GOOG will trade between 415 and 435 for a few days. The next upside target is 490.
Tuesday, December 20, 2005
Gold

Here is an hourly chart of pit and electronic trading in February '06 gold futures.
I thought the market would rally to 518 before beginning another downleg, but it only managed to get to 511.80. Now I think it is heading for 485 where it should start a rally back to 510 or so.
Silver
Here is an hourly chart showing pit and electronic trading in March '06 silver futures.
I had thought that the market would rally to 885 but silver only made it to 875. At the moment it looks like the market will drop to 825 or so and then rally once more, probably back close to the 875 high.
I think that silver will drop into the 620-640 zone before a multi-week rally can start.
S&P


Here is an hourly chart showing pit trading in the March S&P futures.
I thought the market would react to 1264 and the low today thus far is 1264.70. I think we have seen the reaction low and that the market is now headed for 1298.
One piece of evidence supporting my view is today's number (thus far) of advancing issues on the New York Stock Exchange. The daily number is recorded by the black line in the second chart above this post. As you can see today' s price low was lower than yesterday's but the today's number of advancing issues is higher. This is a minor divergence to be sure but it is typically associated with the lows of brief reactions.
Board of Trade

Here is a daily chart of Chicago Board of Trade Holdings.
I had been very bullish on BOT but it has decisively broken support and is also acting much worse than CME and the market averages. This makes me think that when the averages make their bull market top (probably sometime during the next six months) BOT will be trading below its 134 high.
Right now BOT is headed for 84 from which level it should mount at least a 20-30 point rally.
Chicago Merchantile Exchange
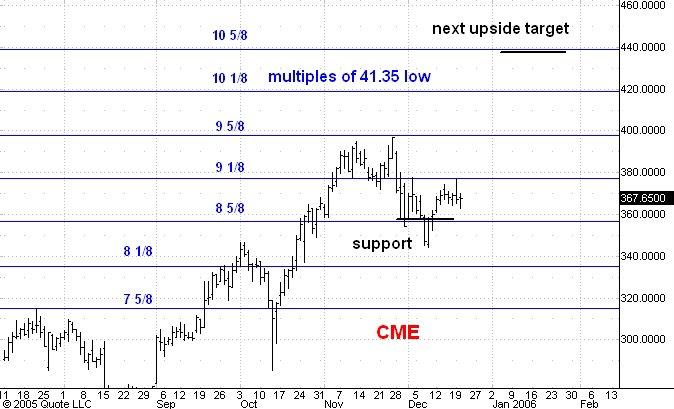
Here is a daily chart of the Chicago Merchantile Exchange.
The market broke 356 support but only briefly. I think it is headed for 440.
US Dollar

Here is an hourly chart of the cash US Dollar index.
I expect the index to reach the 90.50 level and then drop to 88.50.
Eurocurrency
Here is an hourly chart showing pit and electronic trading in the March '06 eurocurrency futures.
I had thought that support at 120.00 would hold but this morning's acceleration below that level means that the market is headed for 119.25. I still think we will see a rally from there to 122.50.
Guesstimates on December 20 , 8:50 am ET
March S&P Futures: Should reach 1264 and then rally to 1298.
March Bonds: I think the bonds are on the way to 113-28. I expect the bonds to rally into the 115-116 zone before the bear market resumes.
March 10 Year Notes: The notes should rally to 109-28. I expect this market to move into the 111-112 zone before the bear market resumes.
March Eurocurrency: Short term support is at the 120.00 level and the next upside target is 122.30. The market is headed for 123.50.
February Crude: I think the market will hold 57.80 and then rally to 64.00. I expect crude to trade in a range of $54 to $64 for several months before going much lower.
February Gold: Market should rally to 518. I think that the 544.90 high will hold for at least several weeks.
March Silver: Silver will rally to 885 or so before dropping to 812. The high at 934.5 (electronic) will hold for at least several weeks.
Google: GOOG will trade between 415 and 435 for a few days. The next upside target is 490.
Monday, December 19, 2005
Google Update
Earlier this morning when GOOG was trading around 443 I said that it would probably react down into the 420-25 zone. The market dropped like a stone after that, hitting 420 and then rallying about 8 points.
I think this reaction will now carry to 416 or so and meantime GOOG will encounter resistance at 435.
S&P

Here is an updated hourly chart showing pit trading in the March '06 S&P futures.
I thought the market would hold support in the 1274-74 zone but after a modest rally the S&P's broke below that level this afternoon. It looks to me like the market is headed for 1264 or so before it can begin a move to the next upside target at 1298.
Crude Oil
Here is an hourly chart showing pit and electronic trading in February '06 crude oil futures.
The market has dropped to support at 57.90 and I think it will now turn upward and rally to 64.00 or so. If I am wrong about an imminent rally then a drop to 55.80 is the worst I see on the downside.
I think crude oil is in a trading range of $55 to $64 and will stay in this range for a couple of months.

Here is an updated daily chart of Google.
As you can see GOOG has reached my last upside target. I think a reaction down into the 420-25 zone is likely. The next step up should carry to 490 or so.
GOOG continues to act better than the market averages so I see no reason yet to worry about the end of the upmove from its IPO price of 85.
Guesstimates on December 19 , 8:50 am ET
March S&P Futures: Should reach 1274 and then rally to 1298.
March Bonds: I think the bonds are on the way to 113-28. I expect the bonds to rally into the 115-116 zone before the bear market resumes.
March 10 Year Notes: The notes should rally to 109-28. I expect this market to move into the 111-112 zone before the bear market resumes.
March Eurocurrency: Short term support is at the 120.00 level and the next upside target is 122.30. The market is headed for 123.50.
January/February Crude: I think the February contract will hold 57.80 and then rally to 64.00. I expect crude to trade in a range of $54 to $64 for several months before going much lower.
February Gold: Market should rally to 518. I think that the 544.90 high will hold for at least several weeks.
March Silver: Silver will rally to 885 or so before dropping to 812. The high at 934.5 (electronic) will hold for at least several weeks.
Google: GOOG will rally to 440.
Friday, December 16, 2005
Crude Oil
Here is an hourly chart showing pit and electronic trading in January '06 crude oil
The market is approaching support at 57.50. From there I think a rally to 63.00 or so will develop.
Silver
Here is an hourly chart of pit and electronic trading in March '06 silver.
I now believe that the market will rally to 887 or so and then drop into the 810-15 zone.
Gold
Here is an hourly chart of pit and electronic trading in February '06 gold.
The market dropped a bit below my 498-500 target zone and then rallied. I think the rally will carry to 518 or so and be followed by another downleg. If the market breaks below 490 (and I think it will) it will be telling us that the 544.90 level will be the top for many months to come and that gold is headed back below 400.
S&P

Here is an hourly chart of pit trading in the March '06 S&P futures.
I still think the market will drop into the 1273-74 zone and then rally to 1298. Morover, I think we will see the 1350 level during the first quarter of 2006.
Guesstimates on December 16 , 8:50 am ET
March S&P Futures: The market is now headed for 1298 with support at 1272.
March Bonds: I think the bonds are on the way to 113-28. I expect the bonds to rally into the 115-116 zone before the bear market resumes.
March 10 Year Notes: The notes should rally to 109-28. I expect this market to move into the 111-112 zone before the bear market resumes.
March Eurocurrency: Short term support is at the 120.00 level and the next upside target is 122.30. The market is headed for 123.50.
January Crude: Should drop to 57.50. I expect crude to trade in a range of $54 to $64 for several months before going much lower.
February Gold: Market hit 498 target in overnight trading and now should rally to 518. I think that the 544.90 high will hold for at least several weeks.
March Silver: Silver held up well while gold broke to 497 so it looks like silver will rally to 885 or so before dropping to 812. The high at 934.5 (electronic) will hold for at least several weeks.
Google: I think GOOG is headed for 440.
Thursday, December 15, 2005
Silver
Here is a chart showing pit and electronic trading in March '06 silver futures.
In this morning's guesstimate I cited the 885 level as resistance but it looks to be like the rally ended at today's high of 872. If so I think the market is about to drop to its next short term downside target around 812.
Crude Oil
Here is a chart showing pit and electronic trading in January '06 crude oil futures.
This market is headed for support at 57.50 and from there a rally into the 63-64 range is likely to begin.
Gold
Here is an hourly chart showing pit and electronic trading in February '06 gold.
I think the rally from this mornigns low near 503 will end around 512 and that the market will then drop into the 498-500 target zone. From there I expect a bigger rally which should carry the market up to 522.
The 544.90 high should hold at least for several weeks and weakness below 498 will be good evidence that the bull market is gold is over.
Bonds
Here is an hourly chart showing pit trading in the March'06 T-bond futures.
I think the market is on its way to 113-28 and eventually into the 115-116 range. Meanwhile support stands at 112-04.
S&P
Here is an hourly chart showing pit trading in the March '06 S&P futures.
I think this market is headed for 1298 and that meantime it will find support around 1274. This would be a break of 10 points or so from the high, just a bit more than the last break on the way up from 1262 and would bring the market down to just above the 1273 breakout level.
US Dollar Index
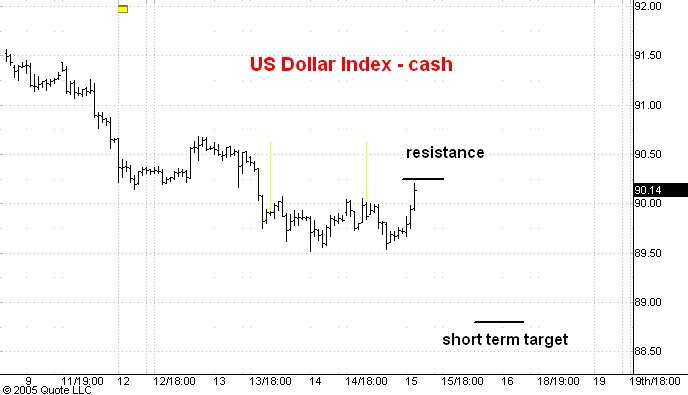
Here is an hourly chart of the cash US Dollar index.
The market has rallied to resistance and now should drop to 88.80 or so.
Eurocurrency

Here is an hourly chart of pit and electronic trading in the March '06 eurocurrency futures.
As you can see the market has dropped to support and I now expect a rally to 122.20 or a bit higher.
Guesstimates on December 15 , 8:55 am ET
March S&P Futures: The market is now headed for 1298 with support at 1272.
March Bonds: I think the bonds are on the way to 113-28. I expect the bonds to rally into the 115-116 zone before the bear market resumes.
March 10 Year Notes: The notes should rally to 109-28. I expect this market to move into the 111-112 zone before the bear market resumes.
March Eurocurrency: Short term support is at the 120.00 level and the next upside target is 122.30. The market is headed for 123.50.
January Crude: Should bounce off the 62.20 level and then drop to 57.50. I expect crude to trade in a range of $54 to $64 for several months before going much lower.
February Gold: Short term support is 498-502 and a bounce upward into the 525-530 range from here would be normal. I think that the 544.90 high will hold for at least several weeks.
March Silver: The market has nearly reached 830 support and a rally to 885 will be the next development. The high at 934.5 (electronic) will hold for at least several weeks.
Google: I think GOOG is now headed for 440.
Wednesday, December 14, 2005
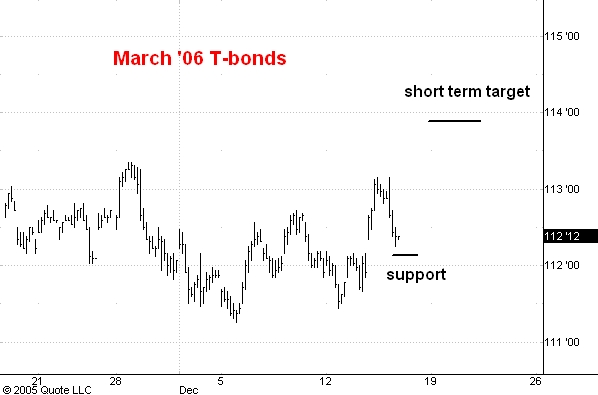
Bonds
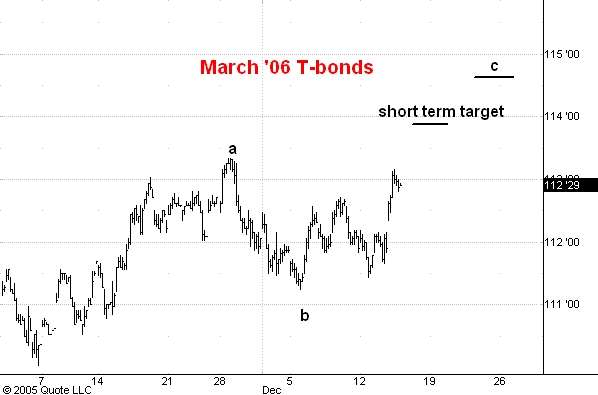
Here is an hourly chart of pit trading in the March '06 t-bond futures.
I think this market will make it into the 115-1165 zone during the next couple of months. Meantime the short term target is 113-28. I think a more substantial reaction will begin from point c at 114-18 because there the rally from b to c will equal the rally from the November 4 low at 110-01 to point a.
US Dollar Index
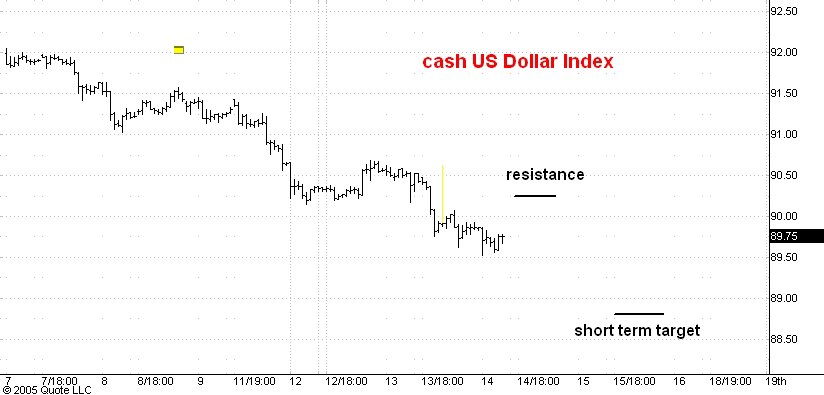
Here is an hourly chart of the cash US dollar index.
I think the market will try to rally to 89.25 or so and then resume its drop to the short term target at 88.80. I still believe the index will make it down to 87.80 before the bull market resumes.
Eurocurrency
Here is an hourly chart of pit and electronic trading in the March '06 eurocurrency futures.
I see support around 120.00 and from there the market should advance to my next upside target around 122.50. The whole move upward from the low at 117.10 should carry into the 123.50 to 124.00 range before the bear market resumes.
Silver
Here is an hourly chart showing pit and electronic trading in March '06 silver.
I still expect to see a temporary low in the 825-30 zone and then a rally to a lower top, probably near 875. Then the market should drop to a lower low around 750.
Gold

Here is an updated hourly chart of pit and electronic trading in February '06 gold futures.
I thought the market would find some short term support near 515 but the crowd is rushing for the exits and gold blew right through the 515 level. I do think a rally will start from the 498-503 zone and probably carry gold up to 520-25. I also think the market will drop to 475 after that rally. The 473 level is 1 and 7/8 times the 1999 low at 252.50.
Guesstimates on December 14 , 8:55 am ET
March S&P Futures: The market is now headed for 1298 with support at 1259.
March Bonds: I think the bonds are on the way to 113-28. I expect the bonds to rally into the 115-116 zone before the bear market resumes.
March 10 Year Notes: The notes should rally to 109-28. I expect this market to move into the 111-112 zone before the bear market resumes.
March Eurocurrency: Short term resistance is 121.50 and reactions should hold the 120.00 level. The market is headed for 123.50.
January Crude: Should bounce off the 62.20 level and then drop to 57.50. I expect crude to trade in a range of $54 to $64 for several months before going much lower.
February Gold: Short term support is at 515 and a bounce upward into the 525-530 range from here would be normal. I think we will see the 498 level soon and that the 544.90 high will hold for at least several weeks.
March Silver: The market is on its way to 830. The high at 934.5 (electronic) will hold for at least several weeks.
Google: I think GOOG is now headed for 440.
Tuesday, December 13, 2005
S&P
Here is an hourly chart of the March '06 S&P futures.
After the Fed announced its latest rate increase this afternoon the market accelerated above 1273, the top of its recent four day trading range. This means that the market has begun a move which will take it up to the next target at 1298.
Caboose on the Bear Train

Here is a shot of the cover of the current issue of Newsweek magazine.
It depicts President Bush in a bubble, protected from and out of touch with the outside world. Not a very flattering portrait! The stories inside the issue are even more derogatory.
As I have pointed out in many of my contrary opinion posts the nation's attitude towards its political leaders and particularly the attitudes of its elites are an important and valuable measure of general market sentiment. It is hard to dispute that the mainstream media have been bashing Bush ever since his presidency began and this Bush-bashing intensified tremendously this past summer and fall. From this I concluded that the US stock market had quite a bit more to go on the upside.
Well, I think the bear train has pulled away from the station. The last car on the train, the caboose, is this Newsweek story and I think from here on out the media will start acknowledging that the country and its economy are in pretty good shape. This will set things up for a bull market top.
IBM
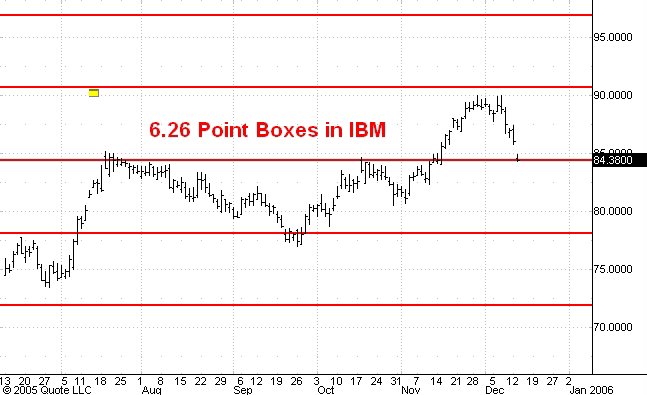
Here is an updated daily chart of IBM.
You can see that during the past week the market has dropped to the bottom of the current box. I see good support at 84 and I think the next swing will carry IBM up to the top of the next box around 97. I think IBM will reach the 106-108 zone over the next few months.
Eurocurrency
Here is an hourly chart of pit and electronic trading in the March '06 eurocurrency futures.
It looks to me like the market will drop to support at 119.30 and then rally to the next upside target at 121.50.
US Dollar
Here is an hourly chart of the cash US dollar index.
Yesterday I said that the market was heading down to 88.80 with and outside chance of going a bit lower to 87.80. But this morning I noticed a mistake in my calculation. The corrected targets at 88.10 and 86.90 and I now think the lower level is in fact more likely than the higher one.
In the meantime I see resistance today in the 90.80 to 91.00 zone and the next downside target is 88.80.
Guesstimates on December 13 , 8:55 am ET
March S&P Futures: The market is now headed for 1298 with support at 1259.
March Bonds: I think the bonds are on the way to 113-28. I expect the bonds to rally into the 115-116 zone before the bear market resumes.
March 10 Year Notes: The notes should rally to 109-28. I expect this market to move into the 111-112 zone before the bear market resumes.
December Eurocurrency: The market is headed for 123.50 with short term resistance at 121.00.
January Crude: Should bounce off the 62.20 level and then drop to 57.50. I expect crude to trade in a range of $54 to $64 for several months before going much lower.
February Gold: Should first drop to 515 and later to 498. Yesterdays high at 544.90 will hold for at least several weeks.
March Silver: The market is on its way to 830. Yesterday’s high at 934.5 (electronic) will hold for at least several weeks.
Google: I think GOOG is now headed for 440.
Monday, December 12, 2005
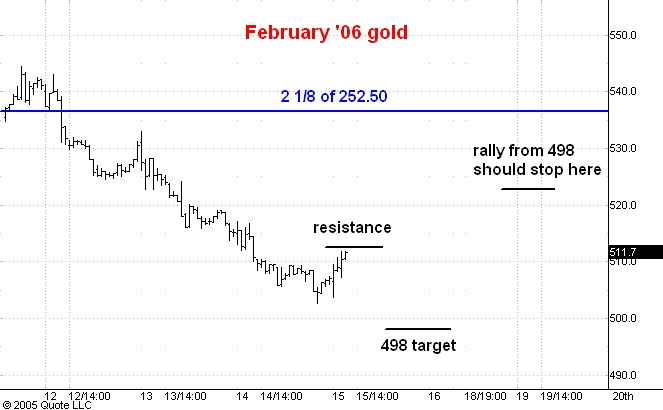
Gold
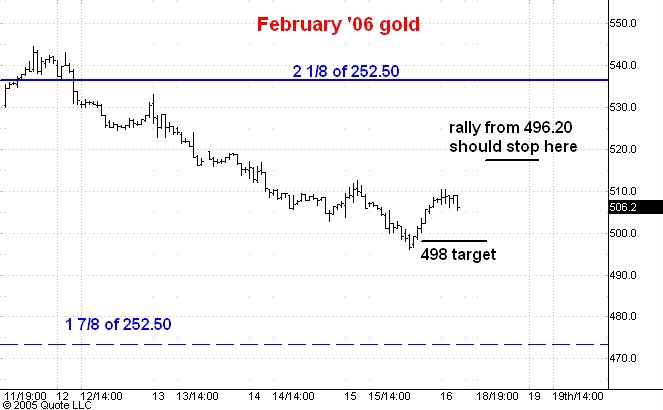
Here is an updated hourly chart of February '06 gold futures.
I think the market made a significant top today and will probably drop to 498 or so over the next few weeks. It has bounced off of strong resistance at 2 1/8 times the bear market low of 252.50. I would regard a move lower than 498 as the first indication that the gold bull market is over.
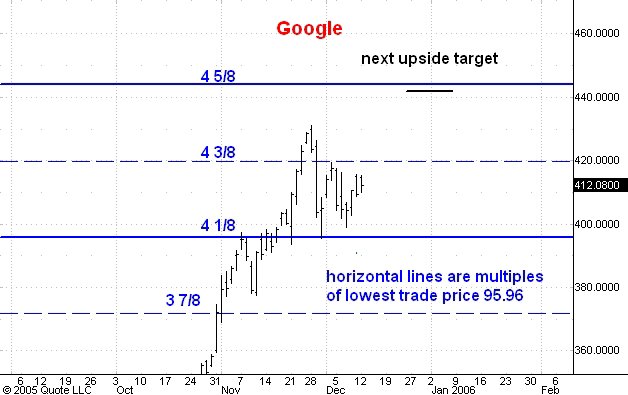
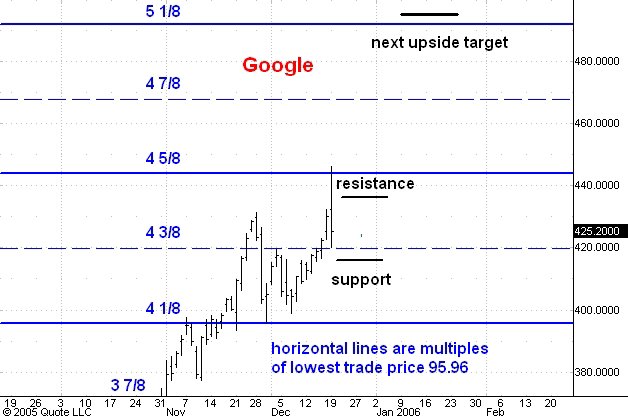
Here is an updated daily chart of Google.
I've got nothing new to say about GOOG but I thought you might like to see another example of caculating support/resistance levels using the "1/8" multiples of a low. The lowest price GOOG actually traded was 95.96 the day after its IPO.
I think GOOG is headed for the 440 area and from there will react at least to 419 and quite possibly to 395.
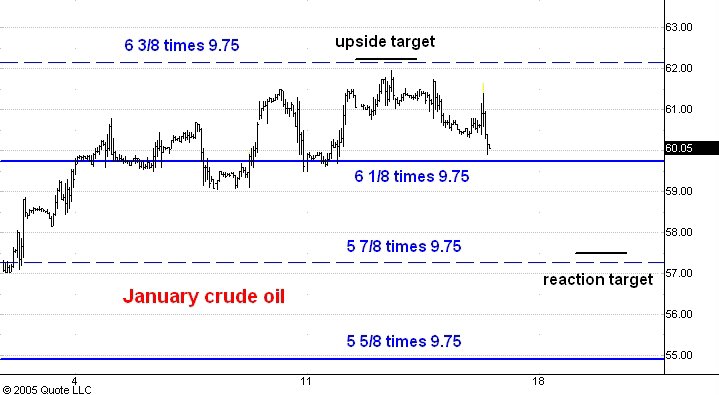
Crude Oil
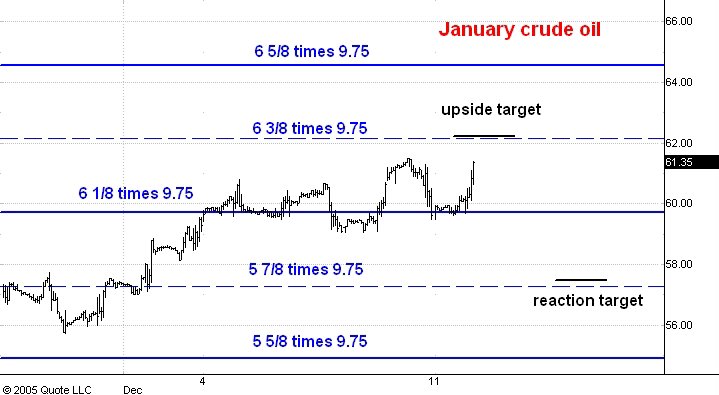
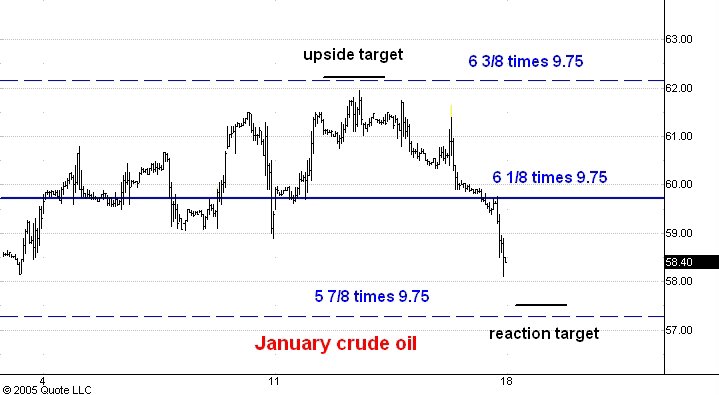
Here is an updated hourly chart of January '06 crude oil futures.
I have drawn in the "1/8 's" multiples of the all time low in futures trading which occurred in April 1986 at $9.75.
As you can see the market has been finding support at the 6 1/8 level and now looks like it is headed for the 6 3/8 level around 62.15. From there I expect a reaction down to the 5 7/8 level around 57.30 and finally a rally to 6 5/8 near 64.60.
Silver
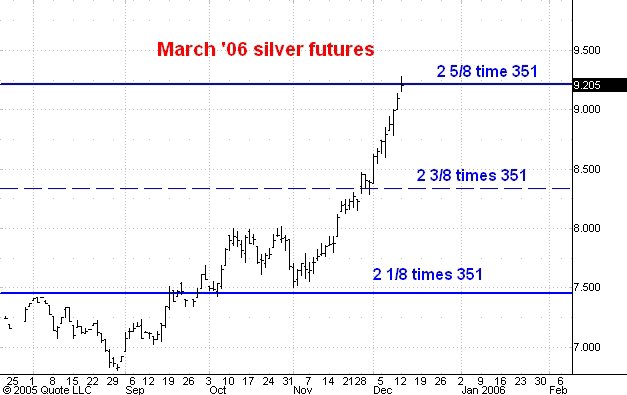
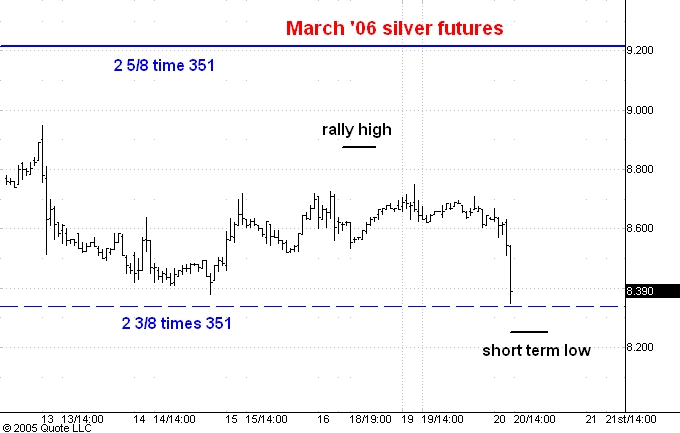
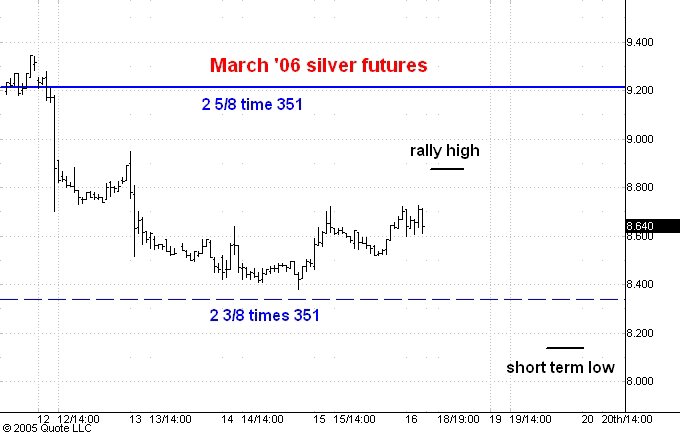
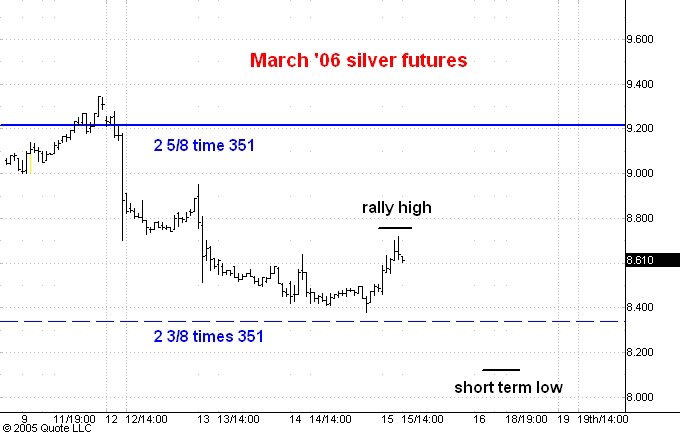
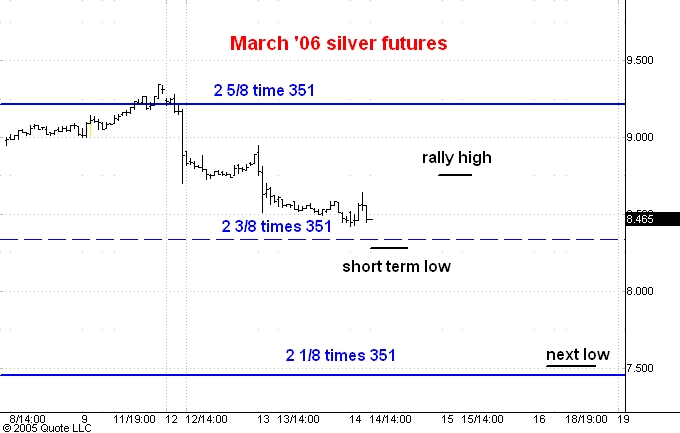
Here is a daily chart of March '06 silver futures.
Back in February 1991 silver established a low of 351 which ended the bear market that started after the infamous Hunt silver corner was broken in January 1980. At the 1980 top silver futures briefly traded above $40!
As I mentioned in a recent gold post, I find it useful to look at multiples of bear market lows when calculating support and resistance levels. The most useful ones are multiples of "1/8" that are not also multiples of "1/4". Of these the most important are the 1/8 and 5/8 multiples.
In the chart above you see strong evidence that the recent run-up is silver is at its end, at least temporarily. March '06 silver today hit the 921 level which is 2 5/8 the 1991 low of 351. Gold hit the 535 level which is 2 1/8 the 1999 low at 252.
I think both markets are about to start substantial reactions from current levels.
US Dollar Index
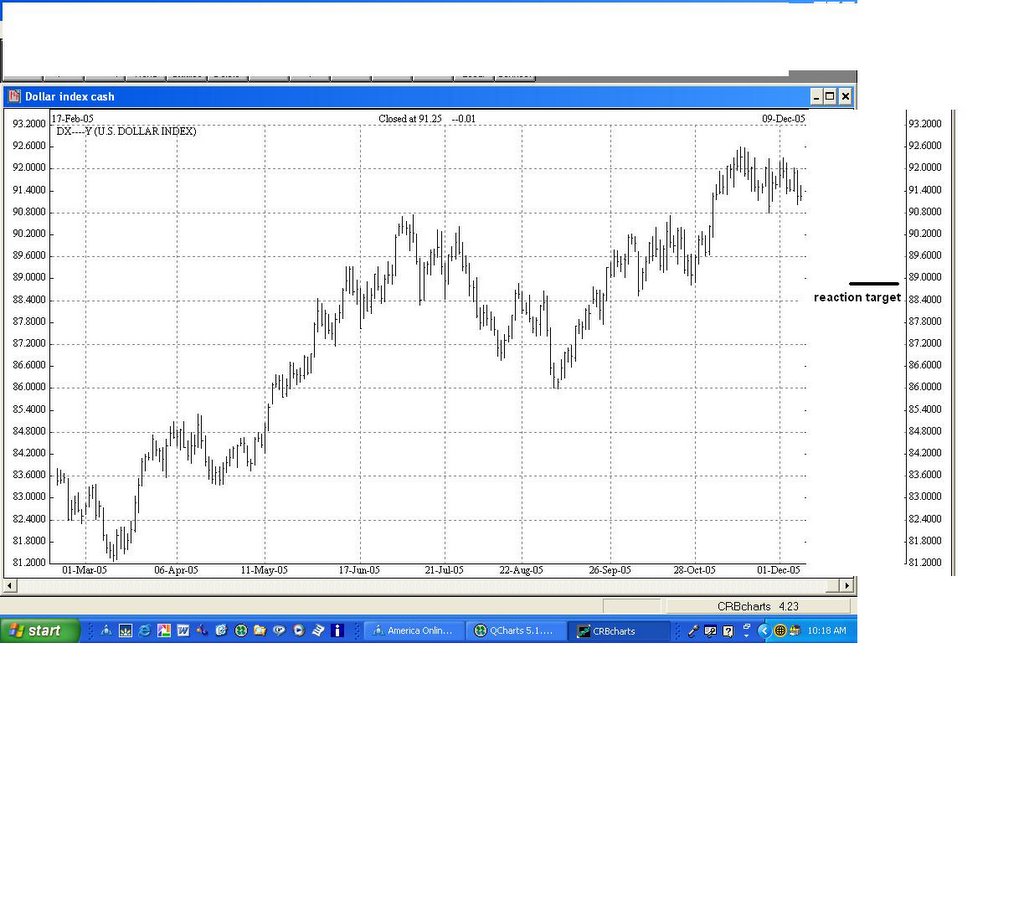
Here is a daily chart of the cash US dollar index.
I think the market is headed down to 88.80. If this reaction turns out to be as big as the July-August break the market would drop a bit further to 87.80 or so, but this is the worst I see on the downside.
The index should reach 100 over the next year. You can find previous posts on the dollar index here and here.
Guesstimates on December 12 , 8:55 am ET
March S&P Futures: The market is now headed for 1298 with support at 1259.
March Bonds: I think the bonds are on the way to 113-28. I expect the bonds to rally into the 115-116 zone before the bear market resumes.
March 10 Year Notes: The notes should rally to 109-28. I expect this market to move into the 111-112 zone before the bear market resumes.
December Eurocurrency: The strong upward move this morning out of a four week trading range means that my 115.50 target will not be reached. Instead the market is in the midst of a move to 123.50. The 121.00 level is short term resistance.
January Crude: The market is headed for 57.50. I expect crude to trade in a range of $54 to $64 for several months before going much lower.
February Gold: Gold has exceeded all my short term upside projections this morning when it reached 544.50. I do think the next $40 move from current levels to be downward and 545 is a short term resistance level.
Google: I think GOOG is now headed for 440.
Sunday, December 11, 2005
Stock Market Posts
This is an index of my posts on the S&P index and other stock market comments.
Here is the most important one- read it first!
Should You Speculate? - April 24, 2005
Here are the rest:
POSTS DURING 2005
December 2005
S&P - December 29
S&P - December 27
2006 Stock Market Forecast - December 23
S&P - December 20
Board of Trade - December 20
Chicago Merchantile Exchange - December 20
S&P - December 19
S&P - December 16
S&P - December 15
S&P - December 13
IBM - December 13
S&P - December 9
Advancing Issues - December 8
S&P - December 8
S&P - December 7
Late Break - December 6
S&P - December 6
CME - December 6
Board of Trade - December 6
S&P - December 5
S&P - December 2
Getting Stronger - December 1
Growing More Bullish - December 1
November 2005
S&P Again - November 30
Advancing Issues - November 30
S&P - November 30
Chicago Board of Trade - November 29
S&P - November 29
Nasdaq Composite Index - November 28
S&P - November 28
Board of Trade - November 28
S&P - November 23
S&P - November 22
Still Lots of Bears - November 22
Chicago Board of Trade - November 21
CME - November 21
Sears Holdings - November 21
S&P Bull Market Boxes - November 18
S&P - November 17
S&P - November 16
Projecting an S&P Top - November 16
IBM - November 16
S&P - November 15
Microsoft - November 11
Board of Trade - November 11
Sears Holdings - November 11
IBM - November 11
S&P - November 10
S&P - November 9
Rydex Cash Flow Ratio - November 8
S&P - November 8
S&P - November 4
Sears Holdings - November 3
Chicago Merchantile Exchange A - November 3
Nasdaq Composite - November 3
S&P - November 3
S&P - November 2
S&P - November 1
The Main Stream Media Just Doing Their Job - November 1
Consumer Sentiment - November 1
October 2005
Three Peaks and a Domed House - October 31
S&P - October 28
S&P - October 27
Onward and Upward - October 24
S&P - October 24
Board of Trade - October 21
CME - October 21
Stock Market Bears - October 21
S&P - October 20
Advancing Issues - October 19
S&P - October 19
S&P - October 18
S&P - October 17
Yikes !!! Bears Are Everywhere! - October 14
NYSE Advancing Issues - October 13
S&P - October 12
Rydex Cash Flows - October 12
S&P - October 11
S&P - October 6
S&P - October 5
S&P - October 4
Top to Top Counts - October 4
S&P - October 3
SEPTEMBER 2005
S&P - September 30
S&P - September 29
IBM - September 29
Rydex Cash Flows - September 29
Google - September 28
Baidu.com - September 28
Stock Market Bears - September 27
S&P - September 26
S&P - September 23
Sears Holdings - September 23
Stock Market Sentiment Update - September 23
S&P Bull Market Boxes - September 22
Another Thought on the S&P - September 21
S&P Update - September 21
Three Peaks and Domed House Update - September 21
S&P - September 21
S&P - September 19
S&P - September 16
Baidu Boxes - September 16
Bearish on Baidu ( What's New? ) - September 16
Google - September 15
S&P - September 15
Baidu on the Close - September 14
Nasdaq Composite Bull Market - September 14
Wall Street Hates Baidu - September 14
Baidu Update - September 13
S&P Reaction - September 13
Bidu.com - September 12
The Plunge Protection Team - September 12
All Disaster, All the Time - September 11
Sears Holdings - September 9
S&P - September 9
Google Boxes - September 9
Baidu Boxes - September 9
Hulbert Sees a Wall of Worry - September 8
Switch to December S&P - September 8
How Far Up ? - September 6
S&P - September 6
"The Bursting Point" - More Gloom and Doom - September 4
S&P - September 1
A Fed Pause and Its Consequences - September 1
Katrina and the Stock Market - September 1
AUGUST 2005
Advancing Issues Update - August 31
Advancing Issues Breakout - August 31
Chicago Merchantile Exchange A - August 31
Sears Holdings - August 31
IBM - August 31
S&P - August 30
NYSE Advancing Issues - August 29
S&P - August 29
Bad Mouthing Baidu - August 27
S&P Rallies - August 25
S&P - August 24
Going Up From Here - August 24
Bearish Sentiment in Stocks - August 24
Divergence Continues - August 23
New Baidu Boxes - August 23
Don't Sell A Dull Market Short - August 23
Low At Hand - August 22
Bye Bye Baidu? - August 22
Still There! - August 18
Another Googlestimate - August 18
More Fun With Baidu - August 18
Divergences - August 17
S&P - August 16
Are Americans "Sour" About Everything? - August 15
Borrowing Baidu.com - August 15
Too Bullish? - August 12
Google - August 11
Sears Holdings - August 10
S&P - August 10
Fun With Baidu.com - August 9
Google - August 9
Baidu, Baidu - August 8
Google + China = Baidu.com - August 6
S&P - August 5
Oops! - August 4
S&P Reactions - August 4
Google - August 2
Stock Market Surprise - August 2
Nasdaq Composite Bull Market Boxes - August 2
Market Habits - August 1
CME - August 1
IBM - August 1
JULY 2005
Creeping Higher - July 28
Google Boxes - July 27
S&P - July 25
S&P - July 21
Testing the S&P - July 20
Google - July 19
IBM - July 19
S&P - July 18
S&P - July 15
Divergences, Divergences - July 15
Chicago Merchantile Exchange A - July 15
Sears Holdings - July 15
Nasdaq Composite - July 14
S&P Bull Market Boxes - July 13
Are They Changing the Lock? - July 12
Google - July 12
S&P Boxes - July 11
Why Do We Feel Blue? - July 10
NYSE Advancing Issues - July 9
NYSE Advancing Issues - July 7
S&P Update - July 7
S&P - July 7
IBM - July 7
S&P - July 6
Google Price Boxes - July 5
JUNE 2005
NYSE Advancing Issues - June 30
S&P - June 30
Headed Up? - June 28
Laughing at Google - June 26
Just Another S&P Reaction? - June 25
S&P June 24
IBM - June 24
Revised S&P Boxes - June 23
Googlestimate - June 23
Hourly S&P - June 21
Bullish Bush Bashing - June 17
S&P: Next Stop 1326? - June 17
Is Low Volume Bearish? - June 16
The Dog That Didn't Bark - June 16
Google - June 15
IBM Will Breakout - June 13
Squawk Blog Makes Fun of Google - June 13
The Slope of Hope - June 13
Google Update - June 12
Hourly Boxes for Cash Nasdaq 100 Index - June 10
Setember S&P Boxes - June 9
Don't Fear the Fed! - June 8
Is Google Overpriced? - June 8
S&P Staircases - June 6
Double, Double Toil and Trouble - June 5
MAY 2005
Microsoft - May 31
IBM - May 31
Google's Next Reaction - May 30
Nasdaq Intermediate Term Trend Projection - May 27
Bull Market Boxes for the Nasdaq Composite - May 27
Google on May 25 - May 25
S&P Update - May 24
S&P Hourly Boxes - May 23
How Far Will This Bull Run? - May 20
Chart of Bull Market Boxes in the S&P - May 19
Bull Market Boxes in the S&P - May 19
Google Boxes (chart) - May 18
Google on May 18 - May 18
S&P boxes (chart) - May 17
Short Term S&P Outlook - May 17
Chart of Three Peaks and Domed House in the Dow - May 16
Model of Three Peaks and Domed House (chart) - May 16
Three Peaks and Domed House in the Dow - May 16
May 12 S&P Boxes (chart) - May 12
S&P Boxes on May 12 - May 12
S&P boxes on May 10 (chart) - May 10
May 10 S&P Boxes - May 10
May 5 S&P Boxes (chart) - May 5
S&P Boxes on May 5 - May 5
Weekly S&P Foldback (chart) - May 4
Lindsay's Foldback Charts - May 4
APRIL 2005
Going Up - April 28
Google (chart) - April 25
How High Can Google Fly? - April 25
Should You Speculate? - April 24
Forecasting Giants of the Past - April 23
The Story of Google - April 22
Yikes! - April 22
Contrary Thoughts on the US Stock Market - April 21
Friday, December 09, 2005
S&P
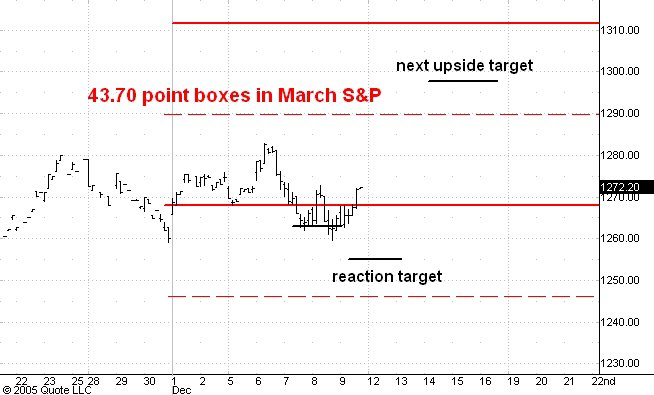
Here is an updated hourly chart of the March '06 S&P futures.
The past two days I have been the yo-yo at the end of the market's string. In any event, this afternoon's acceleration upward out of the first four hours range tells me that the reaction target at 1255 will not be reached and that the market is headed for the 1298 short term upside target. This message is consistent with the improved reading in the advancing issues indicator yesterday which I commented upon here.
Subscribe to:
Posts (Atom)